
Page 268 - Reservoir Geomechanics
P. 268
249 Wellbore failure and stress determination in deviated wells
a. Horizontal distance west (m) Deviation from vertical (deg) b.
500 400 300 200 100 0 0 10 20 30 40 50
2600
2700
S
2800 Hmax
2900
3000
3100
3200
5 10 15 20
3300 P
TVD (m)
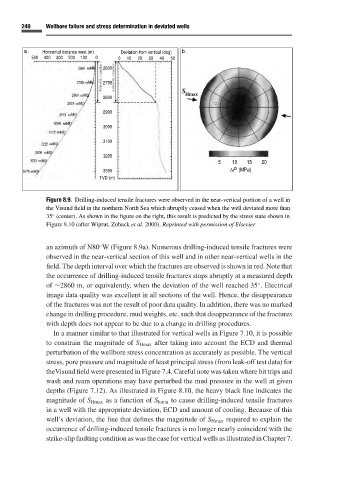
Figure 8.9. Drilling-induced tensile fractures were observed in the near-vertical portion of a well in
the Visund field in the northern North Sea which abruptly ceased when the well deviated more than
35 (center). As shown in the figure on the right, this result is predicted by the stress state shown in
◦
Figure 8.10 (after Wiprut, Zoback et al. 2000). Reprinted with permission of Elsevier.
an azimuth of N80 W (Figure 8.9a). Numerous drilling-induced tensile fractures were
◦
observed in the near-vertical section of this well and in other near-vertical wells in the
field. The depth interval over which the fractures are observed is shown in red. Note that
the occurrence of drilling-induced tensile fractures stops abruptly at a measured depth
of ∼2860 m, or equivalently, when the deviation of the well reached 35 . Electrical
◦
image data quality was excellent in all sections of the well. Hence, the disappearance
of the fractures was not the result of poor data quality. In addition, there was no marked
change in drilling procedure, mud weights, etc. such that disappearance of the fractures
with depth does not appear to be due to a change in drilling procedures.
In a manner similar to that illustrated for vertical wells in Figure 7.10,itis possible
to constrain the magnitude of S Hmax after taking into account the ECD and thermal
perturbation of the wellbore stress concentration as accurately as possible. The vertical
stress, pore pressure and magnitude of least principal stress (from leak-off test data) for
theVisund field were presented in Figure 7.4. Careful note was taken where bit trips and
wash and ream operations may have perturbed the mud pressure in the well at given
depths (Figure 7.12). As illustrated in Figure 8.10, the heavy black line indicates the
magnitude of S Hmax as a function of S hmin to cause drilling-induced tensile fractures
in a well with the appropriate deviation, ECD and amount of cooling. Because of this
well’s deviation, the line that defines the magnitude of S Hmax required to explain the
occurrence of drilling-induced tensile fractures is no longer nearly coincident with the
strike-slip faulting condition as was the case for vertical wells as illustrated in Chapter 7.