
Page 272 - Reservoir Geomechanics
P. 272
253 Wellbore failure and stress determination in deviated wells
a. b. c.
N E S W N N E S W N N E S W N
96.2
55 51
96.4
56 52
tensile
96.6 o
290
80 o
Depth (meters) 96.8 57 302 o o o 53
80
260
97.0 natural 75 o
58 54
ambiguous
97.2
59
55
97.4
ambiguous ambiguous
FMI data BHTV amplitude data
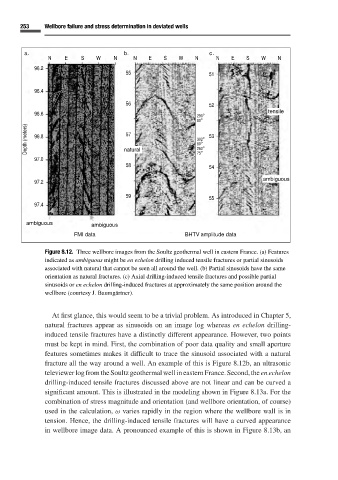
Figure 8.12. Three wellbore images from the Soultz geothermal well in eastern France. (a) Features
indicated as ambiguous might be en echelon drilling induced tensile fractures or partial sinusoids
associated with natural that cannot be seen all around the well. (b) Partial sinusoids have the same
orientation as natural fractures. (c) Axial drilling-induced tensile fractures and possible partial
sinusoids or en echelon drilling-induced fractures at approximately the same position around the
wellbore (courtesy J. Baumg¨artner).
At first glance, this would seem to be a trivial problem. As introduced in Chapter 5,
natural fractures appear as sinusoids on an image log whereas en echelon drilling-
induced tensile fractures have a distinctly different appearance. However, two points
must be kept in mind. First, the combination of poor data quality and small aperture
features sometimes makes it difficult to trace the sinusoid associated with a natural
fracture all the way around a well. An example of this is Figure 8.12b, an ultrasonic
televiewerlogfromtheSoultzgeothermalwellineasternFrance.Second,theenechelon
drilling-induced tensile fractures discussed above are not linear and can be curved a
significant amount. This is illustrated in the modeling shown in Figure 8.13a. For the
combination of stress magnitude and orientation (and wellbore orientation, of course)
used in the calculation, ω varies rapidly in the region where the wellbore wall is in
tension. Hence, the drilling-induced tensile fractures will have a curved appearance
in wellbore image data. A pronounced example of this is shown in Figure 8.13b, an