
Page 277 - Reservoir Geomechanics
P. 277
258 Reservoir geomechanics
a. b.
S Hmax Stress from shear velocity anisotrpy S Hmax Stress from wellbore failure
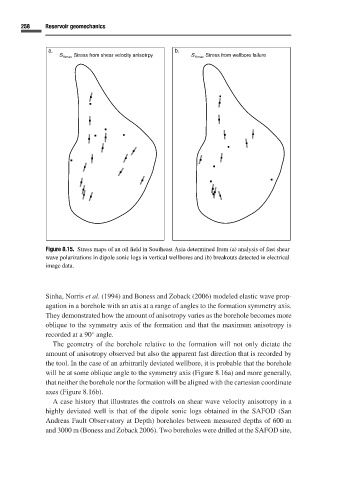
Figure 8.15. Stress maps of an oil field in Southeast Asia determined from (a) analysis of fast shear
wave polarizations in dipole sonic logs in vertical wellbores and (b) breakouts detected in electrical
image data.
Sinha, Norris et al.(1994) and Boness and Zoback (2006) modeled elastic wave prop-
agation in a borehole with an axis at a range of angles to the formation symmetry axis.
They demonstrated how the amount of anisotropy varies as the borehole becomes more
oblique to the symmetry axis of the formation and that the maximum anisotropy is
recorded at a 90 angle.
◦
The geometry of the borehole relative to the formation will not only dictate the
amount of anisotropy observed but also the apparent fast direction that is recorded by
the tool. In the case of an arbitrarily deviated wellbore, it is probable that the borehole
will be at some oblique angle to the symmetry axis (Figure 8.16a) and more generally,
that neither the borehole nor the formation will be aligned with the cartesian coordinate
axes (Figure 8.16b).
A case history that illustrates the controls on shear wave velocity anisotropy in a
highly deviated well is that of the dipole sonic logs obtained in the SAFOD (San
Andreas Fault Observatory at Depth) boreholes between measured depths of 600 m
and 3000 m (Boness and Zoback 2006). Two boreholes were drilled at the SAFOD site,