
Page 309 - Reservoir Geomechanics
P. 309
286 Reservoir geomechanics
Equivalent mud weight (ppg)
8 10 12 14 16 18 20
0
2000
P p b
c
d S
a v
4000
Depth (TVDss)
6000 e
8000
10000
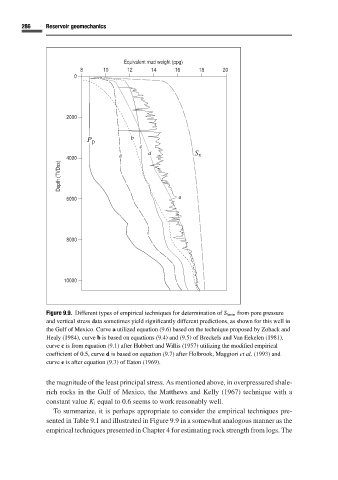
Figure 9.9. Different types of empirical techniques for determination of S hmin from pore pressure
and vertical stress data sometimes yield significantly different predictions, as shown for this well in
the Gulf of Mexico. Curve a utilized equation (9.6) based on the technique proposed by Zoback and
Healy (1984), curve b is based on equations (9.4) and (9.5)of Breckels and Van Eekelen (1981),
curve c is from equation (9.1) after Hubbert and Willis (1957) utilizing the modified empirical
coefficient of 0.5, curve d is based on equation (9.7) after Holbrook, Maggiori et al.(1993) and
curve e is after equation (9.3)of Eaton (1969).
the magnitude of the least principal stress. As mentioned above, in overpressured shale-
rich rocks in the Gulf of Mexico, the Matthews and Kelly (1967) technique with a
constant value K i equal to 0.6 seems to work reasonably well.
To summarize, it is perhaps appropriate to consider the empirical techniques pre-
sented in Table 9.1 and illustrated in Figure 9.9 in a somewhat analogous manner as the
empirical techniques presented in Chapter 4 for estimating rock strength from logs. The