
Page 306 - Reservoir Geomechanics
P. 306
283 Stress fields
a. b.
9100
10000
9,400 psi
9200
9000
9300 8000 SHALE
Depth (feet) Measured stress (psi)
9400 7000 8,000 psi
SAND
9500
6000
9600
5000
50 100 150 6000 7000 8000
5000 6000 7000 8000 9000
Gamma Stress (psi)
Log calculated stress (psi)
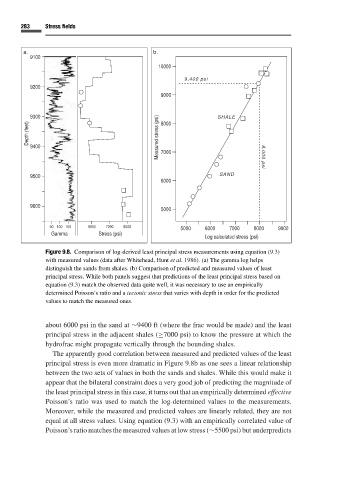
Figure 9.8. Comparison of log-derived least principal stress measurements using equation (9.3)
with measured values (data after Whitehead, Hunt et al. 1986). (a) The gamma log helps
distinguish the sands from shales. (b) Comparison of predicted and measured values of least
principal stress. While both panels suggest that predictions of the least principal stress based on
equation (9.3) match the observed data quite well, it was necessary to use an empirically
determined Poisson’s ratio and a tectonic stress that varies with depth in order for the predicted
values to match the measured ones.
about 6000 psi in the sand at ∼9400 ft (where the frac would be made) and the least
principal stress in the adjacent shales (≥7000 psi) to know the pressure at which the
hydrofrac might propagate vertically through the bounding shales.
The apparently good correlation between measured and predicted values of the least
principal stress is even more dramatic in Figure 9.8bas one sees a linear relationship
between the two sets of values in both the sands and shales. While this would make it
appear that the bilateral constraint does a very good job of predicting the magnitude of
the least principal stress in this case, it turns out that an empirically determined effective
Poisson’s ratio was used to match the log-determined values to the measurements.
Moreover, while the measured and predicted values are linearly related, they are not
equal at all stress values. Using equation (9.3) with an empirically correlated value of
Poisson’s ratio matches the measured values at low stress (∼5500 psi) but underpredicts