
Page 301 - Reservoir Geomechanics
P. 301
279 Stress fields
and pore pressure are obtained in the same well, the same formation and at the same
depth.
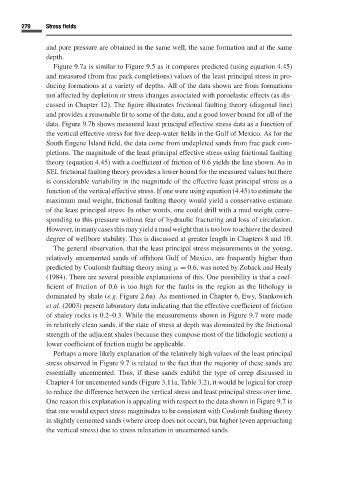
Figure 9.7ais similar to Figure 9.5 as it compares predicted (using equation 4.45)
and measured (from frac pack completions) values of the least principal stress in pro-
ducing formations at a variety of depths. All of the data shown are from formations
not affected by depletion or stress changes associated with poroelastic effects (as dis-
cussed in Chapter 12). The figure illustrates frictional faulting theory (diagonal line)
and provides a reasonable fit to some of the data, and a good lower bound for all of the
data. Figure 9.7b shows measured least principal effective stress data as a function of
the vertical effective stress for five deep-water fields in the Gulf of Mexico. As for the
South Eugene Island field, the data come from undepleted sands from frac pack com-
pletions. The magnitude of the least principal effective stress using frictional faulting
theory (equation 4.45) with a coefficient of friction of 0.6 yields the line shown. As in
SEI, frictional faulting theory provides a lower bound for the measured values but there
is considerable variability in the magnitude of the effective least principal stress as a
function of the vertical effective stress. If one were using equation (4.45)to estimate the
maximum mud weight, frictional faulting theory would yield a conservative estimate
of the least principal stress. In other words, one could drill with a mud weight corre-
sponding to this pressure without fear of hydraulic fracturing and loss of circulation.
However,inmanycasesthismayyieldamudweightthatistoolowtoachievethedesired
degree of wellbore stability. This is discussed at greater length in Chapters 8 and 10.
The general observation, that the least principal stress measurements in the young,
relatively uncemented sands of offshore Gulf of Mexico, are frequently higher than
predicted by Coulomb faulting theory using µ = 0.6, was noted by Zoback and Healy
(1984). There are several possible explanations of this. One possibility is that a coef-
ficient of friction of 0.6 is too high for the faults in the region as the lithology is
dominated by shale (e.g. Figure 2.6a). As mentioned in Chapter 6, Ewy, Stankowich
et al.(2003) present laboratory data indicating that the effective coefficient of friction
of shaley rocks is 0.2–0.3. While the measurements shown in Figure 9.7 were made
in relatively clean sands, if the state of stress at depth was dominated by the frictional
strength of the adjacent shales (because they compose most of the lithologic section) a
lower coefficient of friction might be applicable.
Perhaps a more likely explanation of the relatively high values of the least principal
stress observed in Figure 9.7 is related to the fact that the majority of these sands are
essentially uncemented. Thus, if these sands exhibit the type of creep discussed in
Chapter 4 for uncemented sands (Figure 3.11a, Table 3.2), it would be logical for creep
to reduce the difference between the vertical stress and least principal stress over time.
One reason this explanation is appealing with respect to the data shown in Figure 9.7 is
that one would expect stress magnitudes to be consistent with Coulomb faulting theory
in slightly cemented sands (where creep does not occur), but higher (even approaching
the vertical stress) due to stress relaxation in uncemented sands.