
Page 45 - Reservoir Geomechanics
P. 45
29 Pore pressure at depth in sedimentary basins
pressure in the wellbore and that in the reservoir) affects well stability (Chapter 10), in
the chapters that follow we will assume that pore pressure is constant at the moment a
given calculation is performed.
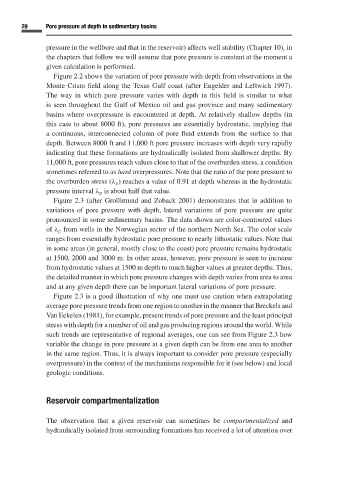
Figure 2.2 shows the variation of pore pressure with depth from observations in the
Monte Cristo field along the Texas Gulf coast (after Engelder and Leftwich 1997).
The way in which pore pressure varies with depth in this field is similar to what
is seen throughout the Gulf of Mexico oil and gas province and many sedimentary
basins where overpressure is encountered at depth. At relatively shallow depths (in
this case to about 8000 ft), pore pressures are essentially hydrostatic, implying that
a continuous, interconnected column of pore fluid extends from the surface to that
depth. Between 8000 ft and 11,000 ft pore pressure increases with depth very rapidly
indicating that these formations are hydraulically isolated from shallower depths. By
11,000 ft, pore pressures reach values close to that of the overburden stress, a condition
sometimes referred to as hard overpressures. Note that the ratio of the pore pressure to
the overburden stress (λ p ) reaches a value of 0.91 at depth whereas in the hydrostatic
pressure interval λ p is about half that value.
Figure 2.3 (after Grollimund and Zoback 2001) demonstrates that in addition to
variations of pore pressure with depth, lateral variations of pore pressure are quite
pronounced in some sedimentary basins. The data shown are color-contoured values
of λ p from wells in the Norwegian sector of the northern North Sea. The color scale
ranges from essentially hydrostatic pore pressure to nearly lithostatic values. Note that
in some areas (in general, mostly close to the coast) pore pressure remains hydrostatic
at 1500, 2000 and 3000 m. In other areas, however, pore pressure is seen to increase
from hydrostatic values at 1500 m depth to much higher values at greater depths. Thus,
the detailed manner in which pore pressure changes with depth varies from area to area
and at any given depth there can be important lateral variations of pore pressure.
Figure 2.3 is a good illustration of why one must use caution when extrapolating
average pore pressure trends from one region to another in the manner that Breckels and
Van Eekelen (1981), for example, present trends of pore pressure and the least principal
stress with depth for a number of oil and gas producing regions around the world. While
such trends are representative of regional averages, one can see from Figure 2.3 how
variable the change in pore pressure at a given depth can be from one area to another
in the same region. Thus, it is always important to consider pore pressure (especially
overpressure) in the context of the mechanisms responsible for it (see below) and local
geologic conditions.
Reservoir compartmentalization
The observation that a given reservoir can sometimes be compartmentalized and
hydraulically isolated from surrounding formations has received a lot of attention over