
Page 50 - Reservoir Geomechanics
P. 50
34 Reservoir geomechanics
B
500 331 330
A
Field blocks 337 331 314 309 308 292
feet
S N
1000
1000
2000 CA
CA DA
EA
3000 DA EA-2
EA
4000 EA-2 GA
HB 1500
IC
5000
GA
JD
6000 KE
HB LF TWT (ms)
OI
7000
JD
KE
8000 LF 2000
MG
9000 OI
10000
11000
2500
12000
13000
14000
3000
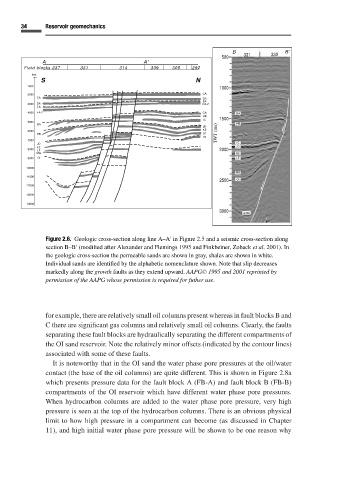
Figure 2.6. Geologic cross-section along line A–A in Figure 2.5 and a seismic cross-section along
section B–B (modified after Alexander and Flemings 1995 and Finkbeiner, Zoback et al. 2001). In
the geologic cross-section the permeable sands are shown in gray, shales are shown in white.
Individual sands are identified by the alphabetic nomenclature shown. Note that slip decreases
markedly along the growth faults as they extend upward. AAPG C 1995 and 2001 reprinted by
permission of the AAPG whose permission is required for futher use.
for example, there are relatively small oil columns present whereas in fault blocks B and
C there are significant gas columns and relatively small oil columns. Clearly, the faults
separating these fault blocks are hydraulically separating the different compartments of
the OI sand reservoir. Note the relatively minor offsets (indicated by the contour lines)
associated with some of these faults.
It is noteworthy that in the OI sand the water phase pore pressures at the oil/water
contact (the base of the oil columns) are quite different. This is shown in Figure 2.8a
which presents pressure data for the fault block A (FB-A) and fault block B (FB-B)
compartments of the OI reservoir which have different water phase pore pressures.
When hydrocarbon columns are added to the water phase pore pressure, very high
pressure is seen at the top of the hydrocarbon columns. There is an obvious physical
limit to how high pressure in a compartment can become (as discussed in Chapter
11), and high initial water phase pore pressure will be shown to be one reason why