
Page 52 - Reservoir Geomechanics
P. 52
36 Reservoir geomechanics
a. b.
Pressure (× 1000 psi) Pressure (× 1000 psi)
3 4 5 6 7 3 4 5 6 7
5500 5500
OI-1 SAND SHALE
6000 6000
6500 Overburden 6500
SSTVD (ft) 7000 FB-B Oil SSTVD (ft) 7000 Overburden
7500 7500
FB-A
FB-B
Gas
8000 Water 8000
Hydrostatic
FB-A
8500 8500 Hydrostatic
Oil
Water
9000 9000
20 24 28 32 36 40 44 48 20 24 28 32 36 40 44 48
Pressure (MPa) Pressure (MPa)
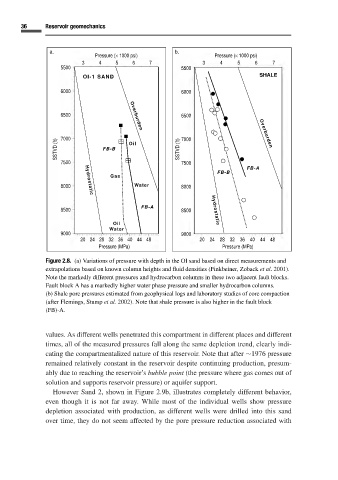
Figure 2.8. (a) Variations of pressure with depth in the OI sand based on direct measurements and
extrapolations based on known column heights and fluid densities (Finkbeiner, Zoback et al. 2001).
Note the markedly different pressures and hydrocarbon columns in these two adjacent fault blocks.
Fault block A has a markedly higher water phase pressure and smaller hydrocarbon columns.
(b) Shale pore pressures estimated from geophysical logs and laboratory studies of core compaction
(after Flemings, Stump et al. 2002). Note that shale pressure is also higher in the fault block
(FB)-A.
values. As different wells penetrated this compartment in different places and different
times, all of the measured pressures fall along the same depletion trend, clearly indi-
cating the compartmentalized nature of this reservoir. Note that after ∼1976 pressure
remained relatively constant in the reservoir despite continuing production, presum-
ably due to reaching the reservoir’s bubble point (the pressure where gas comes out of
solution and supports reservoir pressure) or aquifer support.
However Sand 2, shown in Figure 2.9b, illustrates completely different behavior,
even though it is not far away. While most of the individual wells show pressure
depletion associated with production, as different wells were drilled into this sand
over time, they do not seem affected by the pore pressure reduction associated with