
Page 49 - Reservoir Geomechanics
P. 49
33 Pore pressure at depth in sedimentary basins
MISSISSIPPI
LOUISIANA
New Orleans
Eugene Island 315 316
STUDY AREA FOO T
331 330 WA L L BLOCK 329
B
FAULT
BLOCK B
FAULT
BLOCK A
337 338 339
A
MINIB ASIN
N
3 miles
(4.8 km)
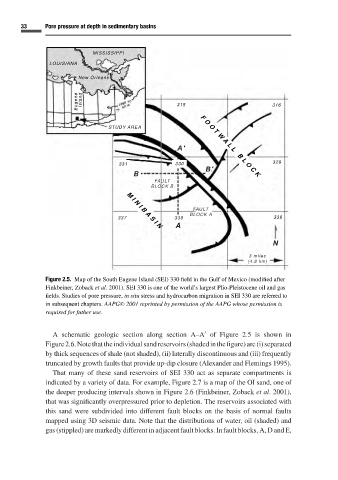
Figure 2.5. Map of the South Eugene Island (SEI) 330 field in the Gulf of Mexico (modified after
Finkbeiner, Zoback et al. 2001). SEI 330 is one of the world’s largest Plio-Pleistocene oil and gas
fields. Studies of pore pressure, in situ stress and hydrocarbon migration in SEI 330 are referred to
in subsequent chapters. AAPG C 2001 reprinted by permission of the AAPG whose permission is
required for futher use.
A schematic geologic section along section A–A of Figure 2.5 is shown in
Figure2.6.Notethattheindividualsandreservoirs(shadedinthefigure)are(i)separated
by thick sequences of shale (not shaded), (ii) laterally discontinuous and (iii) frequently
truncated by growth faults that provide up-dip closure (Alexander and Flemings 1995).
That many of these sand reservoirs of SEI 330 act as separate compartments is
indicated by a variety of data. For example, Figure 2.7 is a map of the OI sand, one of
the deeper producing intervals shown in Figure 2.6 (Finkbeiner, Zoback et al. 2001),
that was significantly overpressured prior to depletion. The reservoirs associated with
this sand were subdivided into different fault blocks on the basis of normal faults
mapped using 3D seismic data. Note that the distributions of water, oil (shaded) and
gas (stippled) are markedly different in adjacent fault blocks. In fault blocks, A, D and E,