
Page 51 - Reservoir Geomechanics
P. 51
35 Pore pressure at depth in sedimentary basins
−5405’
-8000’ Est. O/W
−8400’ −7600’ −5192’
Flt. Bl. “E”
-8000’ −7200’ Est. G/W G/O
Flt. Bl. “D”
−8821’ −8622’ Flt. Bl. “C” -7600’ -7200’ -6800’
Est. Orig. O/W −8800’ Orig. G/O -8400’ -8000’ -7600’
Flt. Bl. “B”
Orig. O/W Orig. G/O −8400’ −8000’ −7600’ −7200’ −7 200’ -6800’ −6011’
LKO
Flt. Bl. “A” Orig. O/W −7400’ −7200’ −6703’ −6356’
−8600’
Est. G/W
−7800’
−8200’
331 330
N Scale:
338
0 1000 2000 3000 4000 5000 ft −8400’ −8000 −7600’ −7600’
0 500 1000 1500 m −8000’
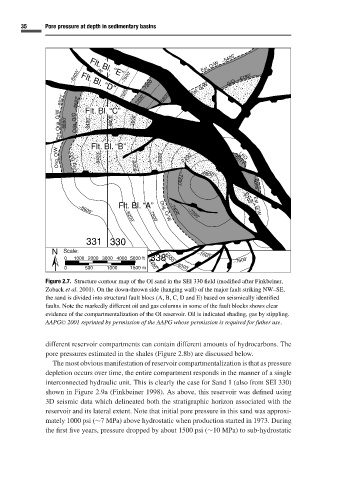
Figure 2.7. Structure contour map of the OI sand in the SEI 330 field (modified after Finkbeiner,
Zoback et al. 2001). On the down-thrown side (hanging wall) of the major fault striking NW–SE,
the sand is divided into structural fault blocs (A, B, C, D and E) based on seismically identified
faults. Note the markedly different oil and gas columns in some of the fault blocks shows clear
evidence of the compartmentalization of the OI reservoir. Oil is indicated shading, gas by stippling.
AAPG C 2001 reprinted by permission of the AAPG whose permission is required for futher use.
different reservoir compartments can contain different amounts of hydrocarbons. The
pore pressures estimated in the shales (Figure 2.8b) are discussed below.
The most obvious manifestation of reservoir compartmentalization is that as pressure
depletion occurs over time, the entire compartment responds in the manner of a single
interconnected hydraulic unit. This is clearly the case for Sand 1 (also from SEI 330)
shown in Figure 2.9a (Finkbeiner 1998). As above, this reservoir was defined using
3D seismic data which delineated both the stratigraphic horizon associated with the
reservoir and its lateral extent. Note that initial pore pressure in this sand was approxi-
mately 1000 psi (∼7MPa) above hydrostatic when production started in 1973. During
the first five years, pressure dropped by about 1500 psi (∼10 MPa) to sub-hydrostatic