
Page 64 - Reservoir Geomechanics
P. 64
48 Reservoir geomechanics
a. b.
Porosity
Pressure 0.10 0.20 0.30 0.40 0.50 f 0
A f
A
HYDROSTATIC
S v
Depth P B Depth f
S hmin
B
TOP
s OVERPRESSURES
v C f C
TRANSITION
E f
E HARD
OVERPRESSURES
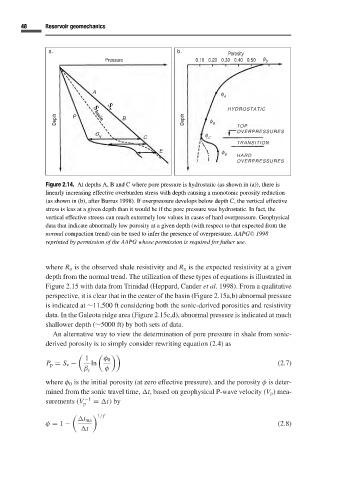
Figure 2.14. At depths A, B and C where pore pressure is hydrostatic (as shown in (a)), there is
linearly increasing effective overburden stress with depth causing a monotonic porosity reduction
(as shown in (b), after Burrus 1998). If overpressure develops below depth C, the vertical effective
stress is less at a given depth than it would be if the pore pressure was hydrostatic. In fact, the
vertical effective streess can reach extremely low values in cases of hard overpressure. Geophysical
data that indicate abnormally low porosity at a given depth (with respect to that expected from the
normal compaction trend) can be used to infer the presence of overpressure. AAPG C 1998
reprinted by permission of the AAPG whose permission is required for futher use.
where R o is the observed shale resistivity and R n is the expected resistivity at a given
depth from the normal trend. The utilization of these types of equations is illustrated in
Figure 2.15 with data from Trinidad (Heppard, Cander et al. 1998). From a qualitative
perspective, it is clear that in the center of the basin (Figure 2.15a,b) abnormal pressure
is indicated at ∼11,500 ft considering both the sonic-derived porosities and resistivity
data. In the Galeota ridge area (Figure 2.15c,d), abnormal pressure is indicated at much
shallower depth (∼5000 ft) by both sets of data.
An alternative way to view the determination of pore pressure in shale from sonic-
derived porosity is to simply consider rewriting equation (2.4)as
1 φ 0
P p = S v − ln (2.7)
β c φ
where φ 0 is the initial porosity (at zero effective pressure), and the porosity φ is deter-
mined from the sonic travel time,
t, based on geophysical P-wave velocity (V p ) mea-
surements (V −1 =
t)by
p
1/f
t ma
φ = 1 − (2.8)
t