Page 65 - Reservoir Geomechanics
P. 65

a.
                               OFFSHORE TRINIDAD                 OFFSHORE TRINIDAD
                                CENTER OF BASIN                    GALEOTA RIDGE
                   2000
                                                                    Effect of uplift
                                                                    Adjusted trend
                   4000                                Trend
                                                       from
                                                       basin
                                                       center       Top Abnormal
                   6000
                                     Normal Compaction
                                     Pressure Trend
                  Depth (ft)  8000


                   10000

                   12000                 Top Abnormal


                   14000


                   16000
                       200  150     100            50  200  150     100           50
                                 Travel time (µs/ft)           Travel time (µs/ft)

                b.
                                  OFFSHORE TRINIDAD                 OFFSHORE TRINIDAD
                                    CENTER OF BASIN                   GALEOTA RIDGE
                   2000
                                                                       Effect of uplift
                                                                       Adjusted trend
                   4000
                                                       Trend from
                                                       basin center
                                                                      Top Abnormal
                   6000               Normal Compaction
                                      Pressure Trend
                  Depth (ft)  8000


                   10000


                   12000                Top Abnormal

                   14000


                   16000
                       .2                         20  .2                         20
                                 Shale resistivity              Shale resistivity
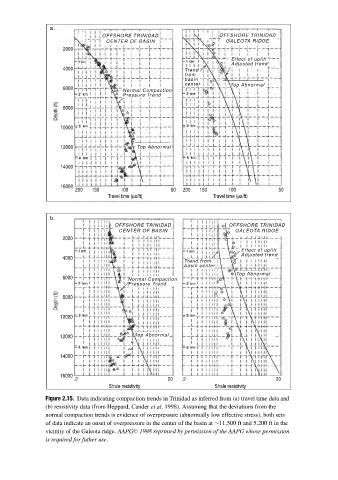
              Figure 2.15. Data indicating compaction trends in Trinidad as inferred from (a) travel time data and
              (b) resistivity data (from Heppard, Cander et al. 1998). Assuming that the deviations from the
              normal compaction trends is evidence of overpressure (abnormally low effective stress), both sets
              of data indicate an onset of overpressure in the center of the basin at ∼11,500 ft and 5,200 ft in the
              vicinity of the Galeota ridge. AAPG C  1998 reprinted by permission of the AAPG whose permission
              is required for futher use.
   60   61   62   63   64   65   66   67   68   69   70