
Page 400 - Rock Mechanics For Underground Mining
P. 400
PILLAR SUPPORTED MINING METHODS
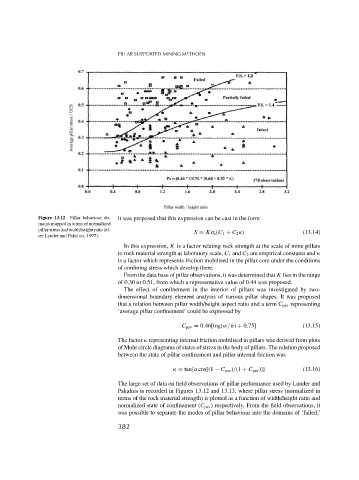
Figure 13.12 Pillar behaviour do- it was proposed that this expression can be cast in the form
mains mapped in terms of normalized
pillar stress and width/height ratio (af- S = K c (C 1 + C 2 ) (13.14)
ter Lunder and Pakalnis, 1997).
In this expression, K is a factor relating rock strength at the scale of mine pillars
to rock material strength at laboratory scale, C 1 and C 2 are empirical constants and
is a factor which represents friction mobilised in the pillar core under the conditions
of confining stress which develop there.
From the data base of pillar observations, it was determined that K lies in the range
of 0.30 to 0.51, from which a representative value of 0.44 was proposed.
The effect of confinement in the interior of pillars was investigated by two-
dimensional boundary element analysis of various pillar shapes. It was proposed
that a relation between pillar width/height aspect ratio and a term C pav representing
‘average pillar confinement’ could be expressed by
C pav = 0.46[log(w/h) + 0.75] (13.15)
The factor representing internal friction mobilised in pillars was derived from plots
of Mohr circle diagrams of states of stress in the body of pillars. The relation proposed
between the state of pillar confinement and pillar internal friction was
= tan{a cos[(1 − C pav )/(1 + C pav )]} (13.16)
The large set of data on field observations of pillar performance used by Lunder and
Pakalnis is recorded in Figures 13.12 and 13.13, where pillar stress (normalized in
terms of the rock material strength) is plotted as a function of width/height ratio and
normalized state of confinement (C pav ) respectively. From the field observations, it
was possible to separate the modes of pillar behaviour into the domains of ‘failed,’
382