
Page 104 - Rotating Machinery Pratical Solutions to Unbalance and Misalignment
P. 104
Rotating Machinery: Practical Solutions
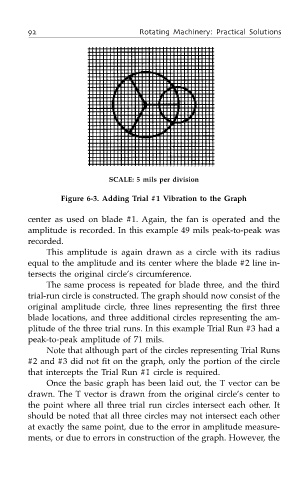
SCALE: 5 mils per division
Figure 6-3. Adding Trial #1 Vibration to the Graph
center as used on blade #1. Again, the fan is operated and the
amplitude is recorded. In this example 49 mils peak-to-peak was
recorded.
This amplitude is again drawn as a circle with its radius
equal to the amplitude and its center where the blade #2 line in-
tersects the original circle’s circumference.
The same process is repeated for blade three, and the third
trial-run circle is constructed. The graph should now consist of the
original amplitude circle, three lines representing the first three
blade locations, and three additional circles representing the am-
plitude of the three trial runs. In this example Trial Run #3 had a
peak-to-peak amplitude of 71 mils.
Note that although part of the circles representing Trial Runs
#2 and #3 did not fit on the graph, only the portion of the circle
that intercepts the Trial Run #1 circle is required.
Once the basic graph has been laid out, the T vector can be
drawn. The T vector is drawn from the original circle’s center to
the point where all three trial run circles intersect each other. It
should be noted that all three circles may not intersect each other
at exactly the same point, due to the error in amplitude measure-
ments, or due to errors in construction of the graph. However, the