
Page 243 - Satellite Communications, Fourth Edition
P. 243
The Space Segment 223
At low-input powers, the output-input power relationship is linear; that
is, a given decibel change in input power will produce the same decibel
change in output power. At higher power inputs, the output power sat-
urates, the point of maximum power output being known as the satu-
ration point. The saturation point is a very convenient reference point,
and input and output quantities are usually referred to it. The linear
region of the TWT is defined as the region bound by the thermal noise
limit at the low end and by what is termed the 1-dB compression point
at the upper end. This is the point where the actual transfer curve drops
1 dB below the extrapolated straight line, as shown in Fig. 7.18. The
selection of the operating point on the transfer characteristic will be con-
sidered in more detail shortly, but first the phase characteristics will be
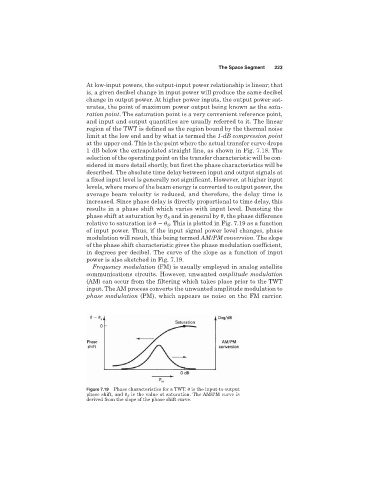
described. The absolute time delay between input and output signals at
a fixed input level is generally not significant. However, at higher input
levels, where more of the beam energy is converted to output power, the
average beam velocity is reduced, and therefore, the delay time is
increased. Since phase delay is directly proportional to time delay, this
results in a phase shift which varies with input level. Denoting the
and in general by
, the phase difference
phase shift at saturation by
S
relative to saturation is
. This is plotted in Fig. 7.19 as a function
S
of input power. Thus, if the input signal power level changes, phase
modulation will result, this being termed AM/PM conversion. The slope
of the phase shift characteristic gives the phase modulation coefficient,
in degrees per decibel. The curve of the slope as a function of input
power is also sketched in Fig. 7.19.
Frequency modulation (FM) is usually employed in analog satellite
communications circuits. However, unwanted amplitude modulation
(AM) can occur from the filtering which takes place prior to the TWT
input. The AM process converts the unwanted amplitude modulation to
phase modulation (PM), which appears as noise on the FM carrier.
Figure 7.19 Phase characteristics for a TWT.
is the input-to-output
phase shift, and
S is the value at saturation. The AM/PM curve is
derived from the slope of the phase shift curve.