
Page 314 - Satellite Communications, Fourth Edition
P. 314
294 Chapter Ten
Where transmission lines form the channel, the frequency response
of the lines also must be taken into account. With a satellite link, the
main channel is the radiofrequency path, which has little effect on the
frequency spectrum but does introduce a propagation delay which must
be taken into account.
At the receive end, bandpass filtering of the incoming signal is nec-
essary to limit the noise which is introduced at this stage. Thus the
signal passes through a number of filtering stages, and the effect of
these on the digital waveform must be taken into account.
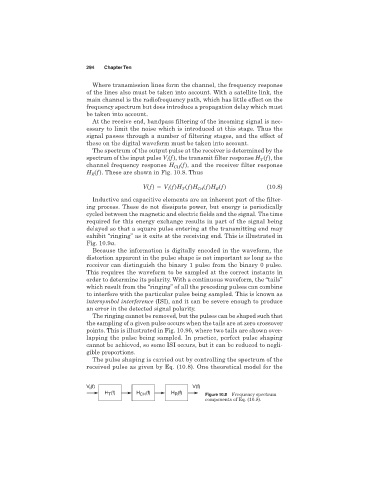
The spectrum of the output pulse at the receiver is determined by the
spectrum of the input pulse V (f), the transmit filter response H (f), the
T
i
channel frequency response H CH (f), and the receiver filter response
(f). These are shown in Fig. 10.8. Thus
H R
V( f ) V ( f )H T ( f )H ( f )H ( f ) (10.8)
i
CH
R
Inductive and capacitive elements are an inherent part of the filter-
ing process. These do not dissipate power, but energy is periodically
cycled between the magnetic and electric fields and the signal. The time
required for this energy exchange results in part of the signal being
delayed so that a square pulse entering at the transmitting end may
exhibit “ringing” as it exits at the receiving end. This is illustrated in
Fig. 10.9a.
Because the information is digitally encoded in the waveform, the
distortion apparent in the pulse shape is not important as long as the
receiver can distinguish the binary 1 pulse from the binary 0 pulse.
This requires the waveform to be sampled at the correct instants in
order to determine its polarity. With a continuous waveform, the “tails”
which result from the “ringing” of all the preceding pulses can combine
to interfere with the particular pulse being sampled. This is known as
intersymbol interference (ISI), and it can be severe enough to produce
an error in the detected signal polarity.
The ringing cannot be removed, but the pulses can be shaped such that
the sampling of a given pulse occurs when the tails are at zero crossover
points. This is illustrated in Fig. 10.9b, where two tails are shown over-
lapping the pulse being sampled. In practice, perfect pulse shaping
cannot be achieved, so some ISI occurs, but it can be reduced to negli-
gible proportions.
The pulse shaping is carried out by controlling the spectrum of the
received pulse as given by Eq. (10.8). One theoretical model for the
V (f) V(f)
i
H (f) H CH (f) H (f) Figure 10.8 Frequency spectrum
T
R
components of Eq. (10.8).