
Page 327 - Satellite Communications, Fourth Edition
P. 327
Digital Signals 307
The equations giving the probability of bit error are derived on the
basis that the filtering provides maximum signal-to-noise ratio. In prac-
tice, there are a number of reasons why the optimal filtering may not be
achieved. The raised-cosine response is a theoretical model that can only
be approximated in practice. Also, for economic reasons, it is desirable
to use production filters manufactured to the same specifications for the
transmit and receive filter functions, and this may result in some devi-
ation from the desired theoretical response. The usual approach in prac-
tice is that one knows the BER that is acceptable for a given application.
The corresponding ratio of bit energy to noise density can then be found
from Eq. (10.18) or from a graph such as that shown in Fig. 10.17. Once
the theoretical value of E /N is found, an implementation margin,
b
0
amounting to a few decibels at most, is added to allow for imperfections
in the filtering. This is illustrated in the following example.
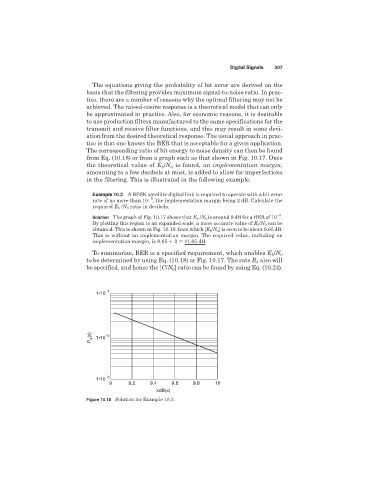
Example 10.3 A BPSK satellite digital link is required to operate with a bit error
5
rate of no more than 10 , the implementation margin being 2 dB. Calculate the
required E b /N 0 ratio in decibels.
5
Solution The graph of Fig. 10.17 shows that E b /N 0 is around 9 dB for a BER of 10 .
By plotting this region to an expanded scale, a more accurate value of E b /N 0 can be
obtained. This is shown in Fig. 10.18. from which [E b /N 0 ] is seen to be about 9.65 dB.
This is without an implementation margin. The required value, including an
implementation margin, is 9.65 2 11.65 dB.
To summarize, BER is a specified requirement, which enables E /N 0
b
to be determined by using Eq. (10.18) or Fig. 10.17. The rate R also will
b
be specified, and hence the [C/N ] ratio can be found by using Eq. (10.24).
0
–4
1•10
P e (x) 1•10 –5
1•10 –6
9 9.2 9.4 9.6 9.8 10
xdB(x)
Figure 10.18 Solution for Example 10.3.