
Page 354 - Satellite Communications, Fourth Edition
P. 354
334 Chapter Eleven
0.1
A
0.01
0.001
Uncoded
Coded
BER 1•10 –4
1•10 –5
1•10 –6
1•10 –7
2 4 6 8 9 9.6 10
E b
dB
N 0
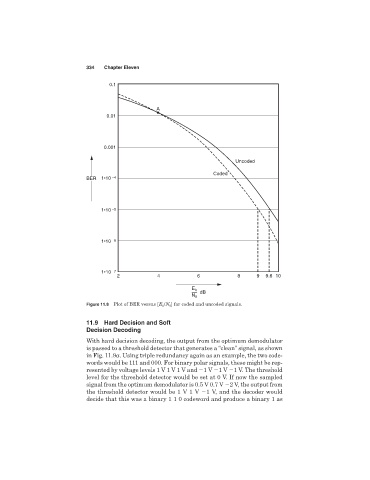
Figure 11.8 Plot of BER versus [E b /N 0 ] for coded and uncoded signals.
11.9 Hard Decision and Soft
Decision Decoding
With hard decision decoding, the output from the optimum demodulator
is passed to a threshold detector that generates a “clean” signal, as shown
in Fig. 11.9a. Using triple redundancy again as an example, the two code-
words would be 111 and 000. For binary polar signals, these might be rep-
resented by voltage levels 1 V 1 V 1 V and 1 V 1 V 1 V. The threshold
level for the threshold detector would be set at 0 V. If now the sampled
signal from the optimum demodulator is 0.5 V 0.7 V 2 V, the output from
the threshold detector would be 1 V 1 V 1 V, and the decoder would
decide that this was a binary 1 1 0 codeword and produce a binary 1 as