Page 331 - Schaum's Outline of Theory and Problems of Signals and Systems
P. 331

318         FOURIER ANALYSIS OF DISCRETE-TIME SIGNALS AND SYSTEMS  [CHAP. 6


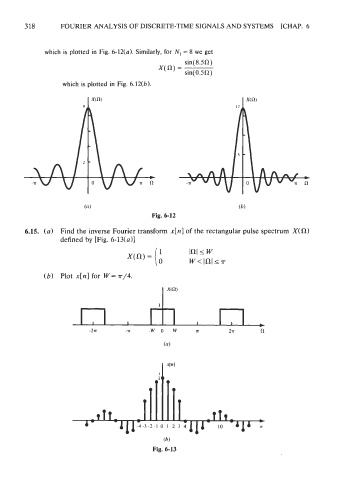
                 which is plotted in  Fig. 6-12(a). Similarly. for  N, = 8 we get


                      which is plotted in  Fig. 6.12(b).


                                                                             (6)
                                                  Fig. 6-12


           6.15.  (a)  Find the inverse Fourier transform x[n] of the rectangular pulse spectrum X(n)
                      defined by [Fig. 6-13(a)]


                 (b)  Plot  x[n] for  W = r/4.

                                                     I xcn)


                                                       .tl n I
                                                    I
                                                    4f)
                                                 a      0
                                               a          0

                                 dl-         w              w      -     t A
                             1'              -4-3-2-10  12  4    1     lo       rr
                                                          3
                                                      (6)
                                                  Fig. 6-13
   326   327   328   329   330   331   332   333   334   335   336