
Page 379 - Sensing, Intelligence, Motion : How Robots and Humans Move in an Unstructured World
P. 379
354 HUMAN PERFORMANCE IN MOTION PLANNING
Another surprise is that the statistics undermines the predominant belief among
subjects and among robotics and cognitive science experts that humans should
be doing significantly better when moving a physical as opposed to a virtual arm.
Isn’t the physical arm quite similar to our own arm, which we use so efficiently?
To be sure, the subjects did better with the physical arm—but only a little
better, not by as much as one would expect, and only for the (easier) left-to-right
direction of motion. Once the task became a bit harder, the difference disappeared:
When moving the physical arm in the right-to-left direction, more often than not
the subjects’ performance was significantly worse than when moving the virtual
arm in the left-to-right direction, and more or less comparable to moving the
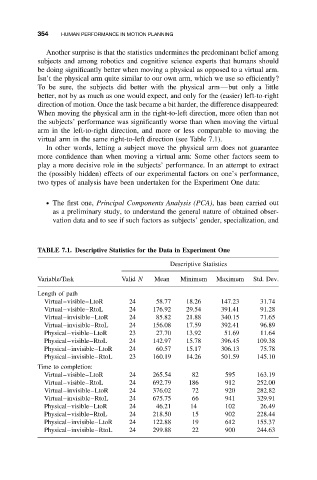
virtual arm in the same right-to-left direction (see Table 7.1).
In other words, letting a subject move the physical arm does not guarantee
more confidence than when moving a virtual arm: Some other factors seem to
play a more decisive role in the subjects’ performance. In an attempt to extract
the (possibly hidden) effects of our experimental factors on one’s performance,
two types of analysis have been undertaken for the Experiment One data:
• The first one, Principal Components Analysis (PCA), has been carried out
as a preliminary study, to understand the general nature of obtained obser-
vation data and to see if such factors as subjects’ gender, specialization, and
TABLE 7.1. Descriptive Statistics for the Data in Experiment One
Descriptive Statistics
Variable/Task Valid N Mean Minimum Maximum Std. Dev.
Length of path
Virtual–visible–LtoR 24 58.77 18.26 147.23 31.74
Virtual–visible–RtoL 24 176.92 29.54 391.41 91.28
Virtual–invisible–LtoR 24 85.82 21.88 340.15 71.65
Virtual–invisible–RtoL 24 156.08 17.59 392.41 96.89
Physical–visible–LtoR 23 27.70 13.92 51.69 11.64
Physical–visible–RtoL 24 142.97 15.78 396.45 109.38
Physical–invisible–LtoR 24 60.57 15.17 306.13 75.78
Physical–invisible–RtoL 23 160.19 14.26 501.59 145.10
Time to completion:
Virtual–visible–LtoR 24 265.54 82 595 163.19
Virtual–visible–RtoL 24 692.79 186 912 252.00
Virtual–invisible–LtoR 24 376.02 72 920 282.82
Virtual–invisible–RtoL 24 675.75 66 941 329.91
Physical–visible–LtoR 24 46.21 14 102 26.49
Physical–visible–RtoL 24 218.50 15 902 228.44
Physical–invisible–LtoR 24 122.88 19 612 155.37
Physical–invisible–RtoL 24 299.88 22 900 244.63