
Page 382 - Sensing, Intelligence, Motion : How Robots and Humans Move in an Unstructured World
P. 382
RESULTS—EXPERIMENT ONE 357
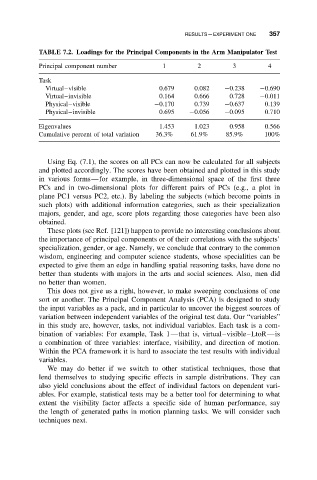
TABLE 7.2. Loadings for the Principal Components in the Arm Manipulator Test
Principal component number 1 2 3 4
Task
Virtual–visible 0.679 0.082 −0.238 −0.690
Virtual–invisible 0.164 0.666 0.728 −0.011
Physical–visible −0.170 0.739 −0.637 0.139
Physical–invisible 0.695 −0.056 −0.095 0.710
Eigenvalues 1.453 1.023 0.958 0.566
Cumulative percent of total variation 36.3% 61.9% 85.9% 100%
Using Eq. (7.1), the scores on all PCs can now be calculated for all subjects
and plotted accordingly. The scores have been obtained and plotted in this study
in various forms—for example, in three-dimensional space of the first three
PCs and in two-dimensional plots for different pairs of PCs (e.g., a plot in
plane PC1 versus PC2, etc.). By labeling the subjects (which become points in
such plots) with additional information categories, such as their specialization
majors, gender, and age, score plots regarding those categories have been also
obtained.
These plots (see Ref. [121]) happen to provide no interesting conclusions about
the importance of principal components or of their correlations with the subjects’
specialization, gender, or age. Namely, we conclude that contrary to the common
wisdom, engineering and computer science students, whose specialities can be
expected to give them an edge in handling spatial reasoning tasks, have done no
better than students with majors in the arts and social sciences. Also, men did
no better than women.
This does not give us a right, however, to make sweeping conclusions of one
sort or another. The Principal Component Analysis (PCA) is designed to study
the input variables as a pack, and in particular to uncover the biggest sources of
variation between independent variables of the original test data. Our “variables”
in this study are, however, tasks, not individual variables. Each task is a com-
bination of variables: For example, Task 1—that is, virtual–visible–LtoR—is
a combination of three variables: interface, visibility, and direction of motion.
Within the PCA framework it is hard to associate the test results with individual
variables.
We may do better if we switch to other statistical techniques, those that
lend themselves to studying specific effects in sample distributions. They can
also yield conclusions about the effect of individual factors on dependent vari-
ables. For example, statistical tests may be a better tool for determining to what
extent the visibility factor affects a specific side of human performance, say
the length of generated paths in motion planning tasks. We will consider such
techniques next.