Page 383 - Sensing, Intelligence, Motion : How Robots and Humans Move in an Unstructured World
P. 383
358    HUMAN PERFORMANCE IN MOTION PLANNING

           7.4.2 Nonparametric Statistics
           Brief Review. Both parametric and nonparametric statistical techniques require
           that observations are drawn from the sampled population randomly and indepen-
           dently. Besides, parametric techniques rely on an assumption that the underlying
           sample data are distributed according to the normal distribution. Nonparametric
           techniques do not impose this constraint. Because the distribution of sample data
           in our experiments looks far from normal, nonparametric methods appear to be
           a more appropriate tool.
              The Mann–Whitney U-test [124] is one of the more powerful nonparamet-
           ric tests. It works by comparing two subgroups of sample data. For a given
           variable under study, the test assesses the hypothesis that two independently
           drawn sets of data come from two populations that differ in some respect—that
           is, differ not only with respect to their means but also with respect to the
           general shape of the distribution. Here the null hypothesis, H 0 , is that both
           samples come from the same population. If the test suggests that the hypoth-
           esis should be rejected, say with the significance level p ≤ 0.01, we will con-
           clude that the samples differ significantly, and hence the variable of interest
           has a significant effect on the sample data. If the test results suggest accept-
           ing the null hypothesis, we will conclude that the two sample sets do not
           differ significantly, and hence the variable of interest has no effect on the sam-
           ple data.
              Order statistics is an ordering of the set X i into a set X (i) such that

                                     X (1) ≤· · ·≤ X (m)

                                 ∗
              Rank, referred to as R , is the new indexing of the set X (i) , such that X i =
                                 i
           X (R ) .
               ∗
               i
              Let X 1 ,. ..,X m and Y 1 ,...,Y n be independent random samples from continu-
           ous distributions with distribution functions F(x) and G(x) = F(x −  ),respec-
           tively, where   is an unknown shift parameter. The hypotheses of interest are:
              • H 0 :   = 0.
              • H 1 :   ≤ 0.

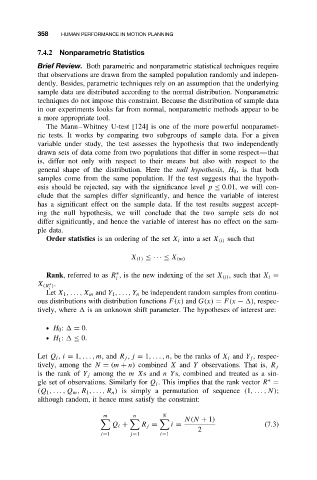
           Let Q i , i = 1,... ,m,and R j ,j = 1,.. .,n, be the ranks of X i and Y j ,respec-
           tively, among the N = (m + n) combined X and Y observations. That is, R j
           is the rank of Y j among the mXsand nYs, combined and treated as a sin-
                                                                           ∗
           gle set of observations. Similarly for Q i . This implies that the rank vector R =
           (Q 1 ,. ..,Q m ,R 1 ,. ..,R n ) is simply a permutation of sequence (1,... ,N);
           although random, it hence must satisfy the constraint:

                              m       n       N
                                                    N(N + 1)

                                Q i +   R j =   i =                       (7.3)
                                                        2
                             i=1     j=1     i=1

