
Page 387 - Sensing, Intelligence, Motion : How Robots and Humans Move in an Unstructured World
P. 387
362 HUMAN PERFORMANCE IN MOTION PLANNING
TABLE 7.6. Results of Mann–Whitney Test on the Interface Factor for LtoR Task
Mann–Whitney Test Variable: Interface (LtoR only). Group 1: Virt; Group 2: Phys
Rank Sum Valid N
Variable Virt Phys U p-Level Virt Phys
Path length 2943.000 1617.000 489.0000 0.000002 48 47
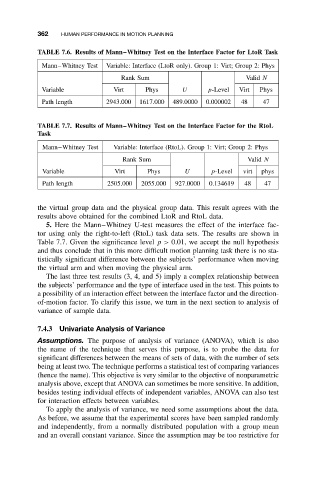
TABLE 7.7. Results of Mann–Whitney Test on the Interface Factor for the RtoL
Task
Mann–Whitney Test Variable: Interface (RtoL). Group 1: Virt; Group 2: Phys
Rank Sum Valid N
Variable Virt Phys U p-Level virt phys
Path length 2505.000 2055.000 927.0000 0.134619 48 47
the virtual group data and the physical group data. This result agrees with the
results above obtained for the combined LtoR and RtoL data.
5. Here the Mann–Whitney U-test measures the effect of the interface fac-
tor using only the right-to-left (RtoL) task data sets. The results are shown in
Table 7.7. Given the significance level p> 0.01, we accept the null hypothesis
and thus conclude that in this more difficult motion planning task there is no sta-
tistically significant difference between the subjects’ performance when moving
the virtual arm and when moving the physical arm.
The last three test results (3, 4, and 5) imply a complex relationship between
the subjects’ performance and the type of interface used in the test. This points to
a possibility of an interaction effect between the interface factor and the direction-
of-motion factor. To clarify this issue, we turn in the next section to analysis of
variance of sample data.
7.4.3 Univariate Analysis of Variance
Assumptions. The purpose of analysis of variance (ANOVA), which is also
the name of the technique that serves this purpose, is to probe the data for
significant differences between the means of sets of data, with the number of sets
being at least two. The technique performs a statistical test of comparing variances
(hence the name). This objective is very similar to the objective of nonparametric
analysis above, except that ANOVA can sometimes be more sensitive. In addition,
besides testing individual effects of independent variables, ANOVA can also test
for interaction effects between variables.
To apply the analysis of variance, we need some assumptions about the data.
As before, we assume that the experimental scores have been sampled randomly
and independently, from a normally distributed population with a group mean
and an overall constant variance. Since the assumption may be too restrictive for