Page 389 - Sensing, Intelligence, Motion : How Robots and Humans Move in an Unstructured World
P. 389
364    HUMAN PERFORMANCE IN MOTION PLANNING

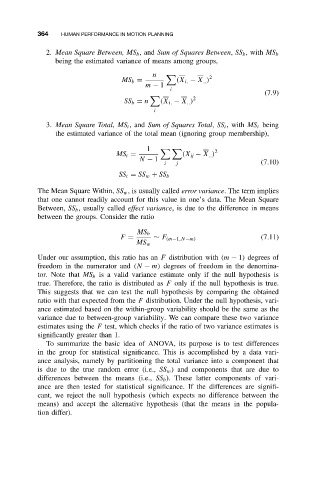
              2. Mean Square Between, MS b ,and Sum of Squares Between, SS b , with MS b
                being the estimated variance of means among groups,
                                           n
                                   MS b =         (X i. − X .. ) 2
                                         m − 1
                                                i
                                                                          (7.9)
                                                       2
                                    SS b = n  (X i. − X .. )
                                            i
              3. Mean Square Total, MS t ,and Sum of Squares Total, SS t , with MS t being
                the estimated variance of the total mean (ignoring group membership),
                                          1                  2
                                 MS t =             (X ij − X .. )
                                        N − 1
                                               i  j                      (7.10)
                                  SS t = SS w + SS b

           The Mean Square Within, SS w , is usually called error variance. The term implies
           that one cannot readily account for this value in one’s data. The Mean Square
           Between, SS b , usually called effect variance, is due to the difference in means
           between the groups. Consider the ratio

                                       MS b
                                  F =       ∼ F (m−1,N−m)                (7.11)
                                       MS w
           Under our assumption, this ratio has an F distribution with (m − 1) degrees of
           freedom in the numerator and (N − m) degrees of freedom in the denomina-
           tor. Note that MS b is a valid variance estimate only if the null hypothesis is
           true. Therefore, the ratio is distributed as F only if the null hypothesis is true.
           This suggests that we can test the null hypothesis by comparing the obtained
           ratio with that expected from the F distribution. Under the null hypothesis, vari-
           ance estimated based on the within-group variability should be the same as the
           variance due to between-group variability. We can compare these two variance
           estimates using the F test, which checks if the ratio of two variance estimates is
           significantly greater than 1.
              To summarize the basic idea of ANOVA, its purpose is to test differences
           in the group for statistical significance. This is accomplished by a data vari-
           ance analysis, namely by partitioning the total variance into a component that
           is due to the true random error (i.e., SS w ) and components that are due to
           differences between the means (i.e., SS b ). These latter components of vari-
           ance are then tested for statistical significance. If the differences are signifi-
           cant, we reject the null hypothesis (which expects no difference between the
           means) and accept the alternative hypothesis (that the means in the popula-
           tion differ).

