
Page 390 - Sensing, Intelligence, Motion : How Robots and Humans Move in an Unstructured World
P. 390
RESULTS—EXPERIMENT ONE 365
7.4.4 Two-Way Analysis of Variance
Main Effects. One-way analysis of variance handles group data for a single
variable. For example, ANOVA can address the effect of visibility by testing
differences between the visible group and the invisible group. Nonparametric
statistics (Section 7.4.2) can do this as well. Sometimes more than one indepen-
dent variable (factor) has to be taken into account.
For example, in the Experiment One data, human performance may be deter-
mined by the visibility factor and also by the interface factor. One important
reason for using the ANOVA method rather than the multiple two-group non-
parametric U-test is the efficiency of the former: With fewer observations we can
gain more information [126].
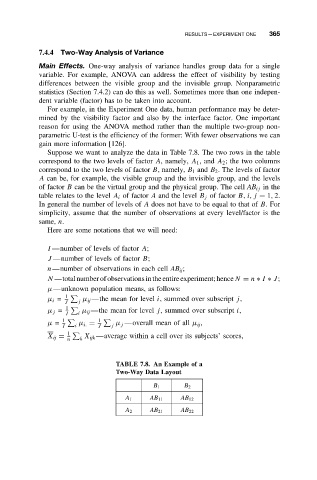
Suppose we want to analyze the data in Table 7.8. The two rows in the table
correspond to the two levels of factor A, namely, A 1 ,and A 2 ; the two columns
correspond to the two levels of factor B, namely, B 1 and B 2 . The levels of factor
A can be, for example, the visible group and the invisible group, and the levels
of factor B can be the virtual group and the physical group. The cell AB ij in the
table relates to the level A i of factor A and the level B j of factor B, i, j = 1, 2.
In general the number of levels of A does not have to be equal to that of B.For
simplicity, assume that the number of observations at every level/factor is the
same, n.
Here are some notations that we will need:
I —number of levels of factor A;
J —number of levels of factor B;
n—number of observations in each cell AB ij ;
N —totalnumberofobservationsintheentireexperiment;henceN = n ∗ I ∗ J;
µ—unknown population means, as follows:
µ i = 1 µ ij —the mean for level i, summed over subscript j,
J j
µ j = 1 µ ij —the mean for level j, summed over subscript i,
I i
µ = 1 µ i. = 1 µ j —overall mean of all µ ij ,
I i J j
1
X ij = X ijk —average within a cell over its subjects’ scores,
n k
TABLE 7.8. An Example of a
Two-Way Data Layout
B 1 B 2
A 1 AB 11 AB 12
A 2 AB 21 AB 22