
Page 393 - Sensing, Intelligence, Motion : How Robots and Humans Move in an Unstructured World
P. 393
368 HUMAN PERFORMANCE IN MOTION PLANNING
MS error—Mean Square for the error variance, or Mean Square Within.
Rows with the effect names “1” and “2” correspond to main effects.
Rows with more than one digit in the name, such as “12” or “123,” relate to
the corresponding interaction effects.
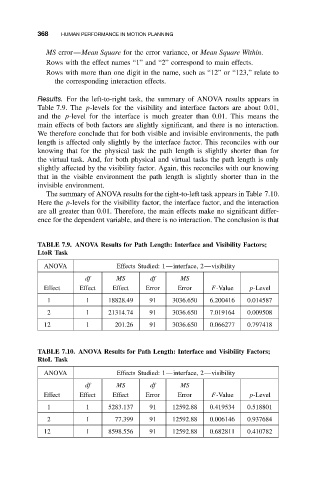
Results. For the left-to-right task, the summary of ANOVA results appears in
Table 7.9. The p-levels for the visibility and interface factors are about 0.01,
and the p-level for the interface is much greater than 0.01. This means the
main effects of both factors are slightly significant, and there is no interaction.
We therefore conclude that for both visible and invisible environments, the path
length is affected only slightly by the interface factor. This reconciles with our
knowing that for the physical task the path length is slightly shorter than for
the virtual task. And, for both physical and virtual tasks the path length is only
slightly affected by the visibility factor. Again, this reconciles with our knowing
that in the visible environment the path length is slightly shorter than in the
invisible environment.
The summary of ANOVA results for the right-to-left task appears in Table 7.10.
Here the p-levels for the visibility factor, the interface factor, and the interaction
are all greater than 0.01. Therefore, the main effects make no significant differ-
ence for the dependent variable, and there is no interaction. The conclusion is that
TABLE 7.9. ANOVA Results for Path Length: Interface and Visibility Factors;
LtoR Task
ANOVA Effects Studied: 1—interface, 2—visibility
df MS df MS
Effect Effect Effect Error Error F-Value p-Level
1 1 18828.49 91 3036.650 6.200416 0.014587
2 1 21314.74 91 3036.650 7.019164 0.009508
12 1 201.26 91 3036.650 0.066277 0.797418
TABLE 7.10. ANOVA Results for Path Length: Interface and Visibility Factors;
RtoL Task
ANOVA Effects Studied: 1—interface, 2—visibility
df MS df MS
Effect Effect Effect Error Error F-Value p-Level
1 1 5283.137 91 12592.88 0.419534 0.518801
2 1 77.399 91 12592.88 0.006146 0.937684
12 1 8598.556 91 12592.88 0.682811 0.410782