Page 388 - Sensing, Intelligence, Motion : How Robots and Humans Move in an Unstructured World
P. 388
RESULTS—EXPERIMENT ONE  363

            real data, we need to address the effect of this assumption being invalid. The
            statistical F test [126] used in the next section is known to be fairly robust to
            deviations from normality. 11
            One-Way Analysis of Variance. The simplest data structure, called a one-way
            layout, has one or more observations at every level of a single factor. We call
            each level of a one-way layout a group or cell. For example, the path length
            scores obtained by subjecting 96 randomly selected subjects to motion planning
            tasks in a visible and invisible environments form a one-way layout. The single
            factor is visibility, and the two groups are visible and invisible. Let us denote
            these groups A 1 and A 2 , respectively.
              The one-way analysis of variance in this example will attempt to answer the
            following question: Do data from the visible and invisible groups really score
            differently on the path length, and is the difference due to the random selection
            of subjects? The corresponding null and alternative hypotheses relate to unknown
            population averages for the groups, µ i :

              • H 0 : µ i = µ  for all A i , i = 1, 2
              • H 1 : µ 1  = µ 2
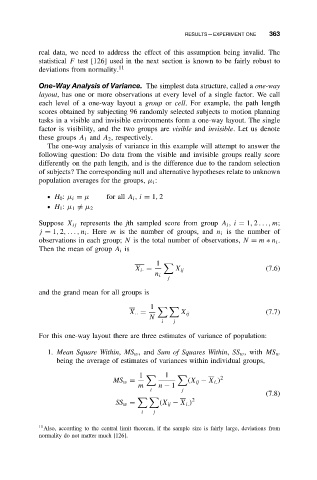
            Suppose X ij represents the jth sampled score from group A i , i = 1, 2 ...,m;
            j = 1, 2,...,n i .Here m is the number of groups, and n i is the number of
            observations in each group; N is the total number of observations, N = m ∗ n i .
            Then the mean of group A i is
                                            1
                                      X i· =      X ij                     (7.6)
                                            n i
                                               j
            and the grand mean for all groups is

                                           1
                                     X ·· =        X ij                    (7.7)
                                          N
                                              i  j
            For this one-way layout there are three estimates of variance of population:

              1. Mean Square Within, MS w ,and Sum of Squares Within, SS w , with MS w
                 being the average of estimates of variances within individual groups,
                                        1      1
                                MS w =               (X ij − X i. ) 2
                                       m     n − 1
                                           i       j
                                                                           (7.8)
                                                      2
                                 SS w =      (X ij − X i. )
                                        i  j
            11 Also, according to the central limit theorem, if the sample size is fairly large, deviations from
            normality do not matter much [126].

