
Page 572 - Sensors and Control Systems in Manufacturing
P. 572
Economic and Social Inter ests in the Workplace
Product 1 Product 2 525
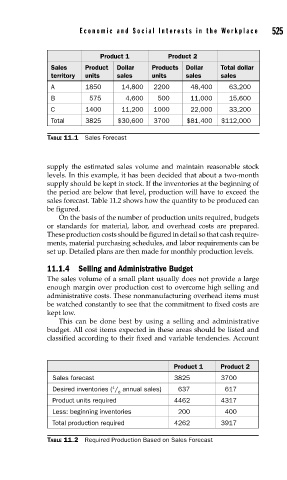
Sales Product Dollar Products Dollar Total dollar
territory units sales units sales sales
A 1850 14,800 2200 48,400 63,200
B 575 4,600 500 11,000 15,600
C 1400 11,200 1000 22,000 33,200
Total 3825 $30,600 3700 $81,400 $112,000
TABLE 11.1 Sales Forecast
supply the estimated sales volume and maintain reasonable stock
levels. In this example, it has been decided that about a two-month
supply should be kept in stock. If the inventories at the beginning of
the period are below that level, production will have to exceed the
sales forecast. Table 11.2 shows how the quantity to be produced can
be figured.
On the basis of the number of production units required, budgets
or standards for material, labor, and overhead costs are prepared.
These production costs should be figured in detail so that cash require-
ments, material purchasing schedules, and labor requirements can be
set up. Detailed plans are then made for monthly production levels.
11.1.4 Selling and Administrative Budget
The sales volume of a small plant usually does not provide a large
enough margin over production cost to overcome high selling and
administrative costs. These nonmanufacturing overhead items must
be watched constantly to see that the commitment to fixed costs are
kept low.
This can be done best by using a selling and administrative
budget. All cost items expected in these areas should be listed and
classified according to their fixed and variable tendencies. Account
Product 1 Product 2
Sales forecast 3825 3700
1
Desired inventories ( / annual sales) 637 617
6
Product units required 4462 4317
Less: beginning inventories 200 400
Total production required 4262 3917
TABLE 11.2 Required Production Based on Sales Forecast