
Page 577 - Sensors and Control Systems in Manufacturing
P. 577
530
Cha p te r
Ele v e n
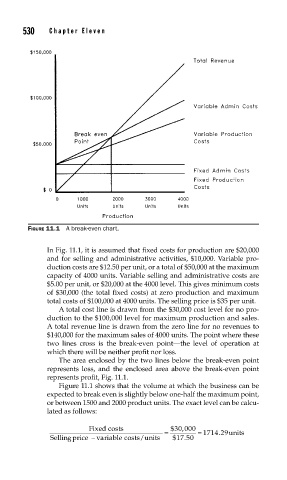
FIGURE 11.1 A break-even chart.
In Fig. 11.1, it is assumed that fixed costs for production are $20,000
and for selling and administrative activities, $10,000. Variable pro-
duction costs are $12.50 per unit, or a total of $50,000 at the maximum
capacity of 4000 units. Variable selling and administrative costs are
$5.00 per unit, or $20,000 at the 4000 level. This gives minimum costs
of $30,000 (the total fixed costs) at zero production and maximum
total costs of $100,000 at 4000 units. The selling price is $35 per unit.
A total cost line is drawn from the $30,000 cost level for no pro-
duction to the $100,000 level for maximum production and sales.
A total revenue line is drawn from the zero line for no revenues to
$140,000 for the maximum sales of 4000 units. The point where these
two lines cross is the break-even point—the level of operation at
which there will be neither profit nor loss.
The area enclosed by the two lines below the break-even point
represents loss, and the enclosed area above the break-even point
represents profit, Fig. 11.1.
Figure 11.1 shows that the volume at which the business can be
expected to break even is slightly below one-half the maximum point,
or between 1500 and 2000 product units. The exact level can be calcu-
lated as follows:
Fixed costs $30 000
,
= = 1714 29units
.
Sellingprice − variable costs/units $ 17 50
.