
Page 578 - Sensors and Control Systems in Manufacturing
P. 578
Economic and Social Inter ests in the Workplace
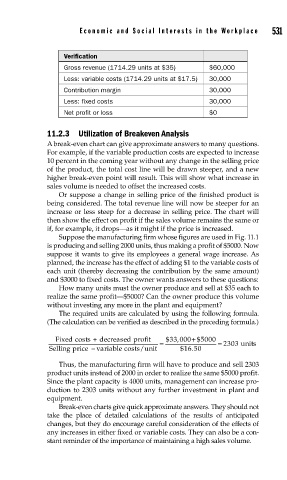
Verification 531
Gross revenue (1714.29 units at $35) $60,000
Less: variable costs (1714.29 units at $17.5) 30,000
Contribution margin 30,000
Less: fixed costs 30,000
Net profit or loss $0
11.2.3 Utilization of Breakeven Analysis
A break-even chart can give approximate answers to many questions.
For example, if the variable production costs are expected to increase
10 percent in the coming year without any change in the selling price
of the product, the total cost line will be drawn steeper, and a new
higher break-even point will result. This will show what increase in
sales volume is needed to offset the increased costs.
Or suppose a change in selling price of the finished product is
being considered. The total revenue line will now be steeper for an
increase or less steep for a decrease in selling price. The chart will
then show the effect on profit if the sales volume remains the same or
if, for example, it drops—as it might if the price is increased.
Suppose the manufacturing firm whose figures are used in Fig. 11.1
is producing and selling 2000 units, thus making a profit of $5000. Now
suppose it wants to give its employees a general wage increase. As
planned, the increase has the effect of adding $1 to the variable costs of
each unit (thereby decreasing the contribution by the same amount)
and $3000 to fixed costs. The owner wants answers to these questions:
How many units must the owner produce and sell at $35 each to
realize the same profit—$5000? Can the owner produce this volume
without investing any more in the plant and equipment?
The required units are calculated by using the following formula.
(The calculation can be verified as described in the preceding formula.)
Fixed costs + decreased profit = $33 000 + $5000
,
Selling price − variable costs/unit $16 .50 = 2303 units
Thus, the manufacturing firm will have to produce and sell 2303
product units instead of 2000 in order to realize the same $5000 profit.
Since the plant capacity is 4000 units, management can increase pro-
duction to 2303 units without any further investment in plant and
equipment.
Break-even charts give quick approximate answers. They should not
take the place of detailed calculations of the results of anticipated
changes, but they do encourage careful consideration of the effects of
any increases in either fixed or variable costs. They can also be a con-
stant reminder of the importance of maintaining a high sales volume.