
Page 590 - Sensors and Control Systems in Manufacturing
P. 590
(3)
(2)
(4)
(1) Economic and Social Inter ests in the Workplace 543
(5)
Hours Units Expected Expected Expected
per unit observed probability hours cost at $5
1 100 0.1 0.1 $0.50
2 200 0.2 0.4 2.00
1
2 / 400 0.4 1.0 5.00
2
3 300 0.3 0.9 4.50
Total 1000 1.00 2.4 $12.00
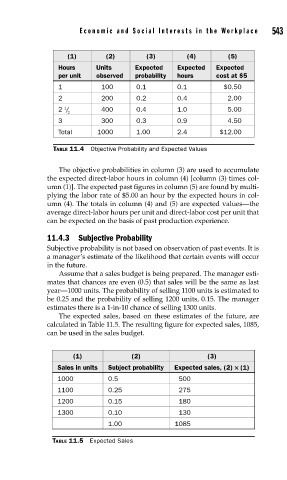
TABLE 11.4 Objective Probability and Expected Values
The objective probabilities in column (3) are used to accumulate
the expected direct-labor hours in column (4) [column (3) times col-
umn (1)]. The expected past figures in column (5) are found by multi-
plying the labor rate of $5.00 an hour by the expected hours in col-
umn (4). The totals in column (4) and (5) are expected values—the
average direct-labor hours per unit and direct-labor cost per unit that
can be expected on the basis of past production experience.
11.4.3 Subjective Probability
Subjective probability is not based on observation of past events. It is
a manager’s estimate of the likelihood that certain events will occur
in the future.
Assume that a sales budget is being prepared. The manager esti-
mates that chances are even (0.5) that sales will be the same as last
year—1000 units. The probability of selling 1100 units is estimated to
be 0.25 and the probability of selling 1200 units, 0.15. The manager
estimates there is a 1-in-10 chance of selling 1300 units.
The expected sales, based on these estimates of the future, are
calculated in Table 11.5. The resulting figure for expected sales, 1085,
can be used in the sales budget.
(1) (2) (3)
Sales in units Subject probability Expected sales, (2) ¥ (1)
1000 0.5 500
1100 0.25 275
1200 0.15 180
1300 0.10 130
1.00 1085
TABLE 11.5 Expected Sales