
Page 593 - Sensors and Control Systems in Manufacturing
P. 593
546
Ele v e n
Cha p te r
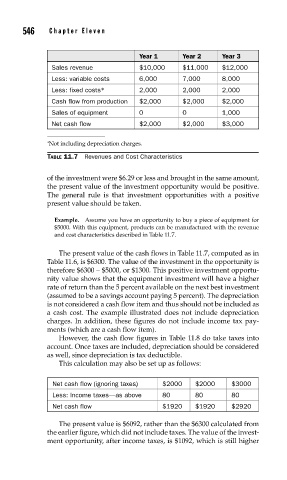
Year 1 Year 2 Year 3
Sales revenue $10,000 $11,000 $12,000
Less: variable costs 6,000 7,000 8,000
Less: fixed costs* 2,000 2,000 2,000
Cash flow from production $2,000 $2,000 $2,000
Sales of equipment 0 0 1,000
Net cash flow $2,000 $2,000 $3,000
∗ Not including depreciation charges.
TABLE 11.7 Revenues and Cost Characteristics
of the investment were $6.29 or less and brought in the same amount,
the present value of the investment opportunity would be positive.
The general rule is that investment opportunities with a positive
present value should be taken.
Example. Assume you have an opportunity to buy a piece of equipment for
$5000. With this equipment, products can be manufactured with the revenue
and cost characteristics described in Table 11.7.
The present value of the cash flows in Table 11.7, computed as in
Table 11.6, is $6300. The value of the investment in the opportunity is
therefore $6300 – $5000, or $1300. This positive investment opportu-
nity value shows that the equipment investment will have a higher
rate of return than the 5 percent available on the next best investment
(assumed to be a savings account paying 5 percent). The depreciation
is not considered a cash flow item and thus should not be included as
a cash cost. The example illustrated does not include depreciation
charges. In addition, these figures do not include income tax pay-
ments (which are a cash flow item).
However, the cash flow figures in Table 11.8 do take taxes into
account. Once taxes are included, depreciation should be considered
as well, since depreciation is tax deductible.
This calculation may also be set up as follows:
Net cash flow (ignoring taxes) $2000 $2000 $3000
Less: Income taxes—as above 80 80 80
Net cash flow $1920 $1920 $2920
The present value is $6092, rather than the $6300 calculated from
the earlier figure, which did not include taxes. The value of the invest-
ment opportunity, after income taxes, is $1092, which is still higher