
Page 73 - Separation process principles 2
P. 73
38 Chapter 2 Thermodynamics of Separation Operations
!
4,000
2,000
0 Critical points
1.000
Carbon dioxide
600
400
.- 200
u
* 100
. 60
2
40
V)
2 20
a
L
g 10
5 6
4
2
1
0.6
0.4
0.2
0.1
-1 0
Temperature, "F
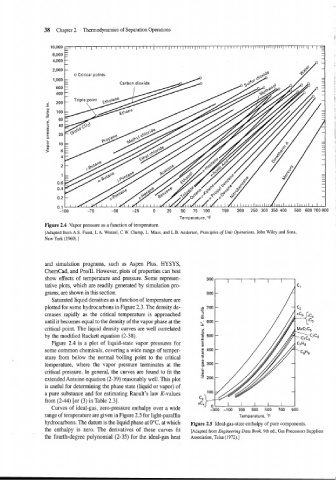
Figure 2.4 Vapor pressure as a function of temperature.
[Adapted from A.S. Faust, L.A. Wenzel, C.W. Clump, L. Maus, and L.B. Andersen, Principles of Unit Operations, John Wiley and Sons,
New York (1960).]
and simulation programs, such as Aspen Plus, HYSYS,
ChemCad, and Pro/II. However, plots of properties can best
show effects of temperature and pressure. Some represen-
tative plots, which are readily generated by simulation pro-
grams, are shown in this section.
Saturated liquid densities as a function of temperature are
plotted for some hydrocarbons in Figure 2.3. The density de-
creases rapidly as the critical temperature is approached
until it becomes equal to the density of the vapor phase at the
critical point. The liquid density curves are well correlated
by the modified Rackett equation (2-38).
Figure 2.4 is a plot of liquid-state vapor pressures for
some common chemicals, covering a wide range of temper-
ature from below the normal boiling point to the critical
temperature, where the vapor pressure terminates at the
critical pressure. In general, the curves are found to fit the
extended Antoine equation (2-39) reasonably well. This plot
is useful for determining the phase state (liquid or vapor) of
a pure substance and for estimating Raoult's law K-values
from (2-44) [or (3) in Table 2.31.
Curves of ideal-gas, zero-pressure enthalpy over a wide -300 -100 loo 300 500 700 goo
range of temperature are given in Figure 2.5 for light-paraffin Temperature, "F
hydrocarbons. The datum is the liquid phase at O°C, at which Figure 2.5 Ideal-gas-state enthalpy of pure components.
the enthal~~ zero. The derivatives of these curves f t [Adapted from Engineering Data Book, 9th ed., Gas Processors Suppliers
is
the fourth-degree polynomial (2-35) for the ideal-gas heat Association, Tulsa (1972).]