
Page 74 - Separation process principles 2
P. 74
2.4 Graphical Correlations of Thermodynamic Properties 39
Nomographs for determining the effects of temperature
and pressure on the K-values of hydrocarbons and light gases
are presented in Figures 2.8 and 2.9, which are taken from
Hadden and Grayson [15]. In both charts, all K-values col-
lapse to 1.0 at a pressure of 5,000 psia (34.5 MPa). This pres-
sure, called the convergence pressure, depends on the boil-
ing range of the components in the mixture. For example,
in Figure 2.10 the components of the mixture (N2 to nClo)
cover a very wide boiling-point range, resulting in a conver-
gence pressure of close to 2,500 psia. For narrow-boiling
mixtures, such as a mixture of ethane and propane, the con-
vergence pressure is generally less than 1,000 psia. The K-
1 I I I I I I value charts of Figures 2.8 and 2.9 apply strictly to a conver-
-300 -200 -100 O 100 200 300 400 500 gence pressure of 5,000 psia. A detailed procedure for
Temperature, OF
correcting for the convergence pressure is given by Hadden
Figure 2.6 Ideal-gas-state entropy of pure components. and Grayson [15]. Use of the nomographs is illustrated
[Adapted from Engineering Data Book, 9th ed., Gas Processors Suppliers below in Exercise 2.4.
Association, Tulsa (1972).]
No simple charts are available for estimating liquid-
liquid equilibrium constants (distribution coefficients)
because of the pronounced effect of composition. How-
capacity reasonably well. Curves of ideal-gas entropy of sev- ever, for ternary systems that are dilute in the solute and
eral light gases, over a wide range of temperature, are given in involve almost immiscible solvents, an extensive tabulation
Figure 2.6. of distribution coefficients for the solute is given by
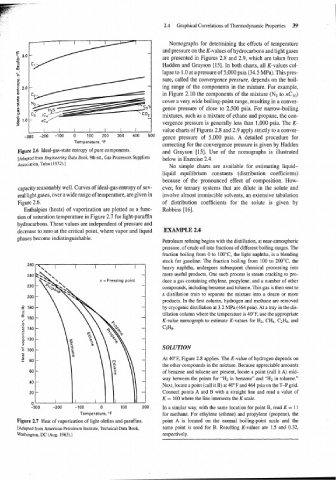
Enthalpies (heats) of vaporization are plotted as a func- Robbins [16].
tion of saturation temperature in Figure 2.7 for light-paraffin
hydrocarbons. These values are independent of pressure and
decrease to zero at the critical point, where vapor and liquid EXAMPLE 2.4
phases become indistinguishable.
Petroleum refining begins with the distillation, at near-atmospheric
pressure, of crude oil into fractions of different boiling ranges. The
fraction boiling from 0 to 100°C, the light naphtha, is a blending
stock for gasoline. The fraction boiling from 100 to 200°C, the
heavy naphtha, undergoes subsequent chemical processing into
more useful products. One such process is steam cracking to pro-
duce a gas containing ethylene, propylene, and a number of other
compounds, including benzene and toluene. This gas is then sent to
a distillation train to separate the mixture into a dozen or more
products. In the first column, hydrogen and methane are removed
by cryogenic distillation at 3.2 MPa (464 psia). At a tray in the dis-
tillation column where the temperature is 40°F, use the appropriate
K-value nomograph to estimate K-values for Hz, CH4, C2H4, and
C3H6.
SOLUTION
At 40"F, Figure 2.8 applies. The K-value of hydrogen depends on
the other compounds in the mixture. Because appreciable amounts
of benzene and toluene are present, locate a point (call it A) mid-
way between the points for "Hz in benzene" and "H2 in toluene."
Next, locate a point (call it B) at 40°F and 464 psia on the T-P grid.
Connect points A and B with a straight line and read a value of
K = 100 where the line intersects the K.scale.
"
-300 -200 -100 0 100 200 In a similar way, with the same location for point B, read K = 11
Temperature, OF for methane. For ethylene (ethene) and propylene (propene), the
Figure 2.7 Heat of vaporization of light olefins and paraffins. point A is located on the normal boiling-point scale and the
[Adapted from American Petroleum Institute, Technical Data Book, same point is used for B. Resulting K-values are 1.5 and 0.32,
Washington, DC (Aug. 1963).] respectively.