
Page 19 - Serious Incident Prevention How to Achieve and Sustain Accident-Free Operations in Your Plant or Company
P. 19
CH01pp001-020 4/10/02 12:49 PM Page 5
The Improvement Challenge 5
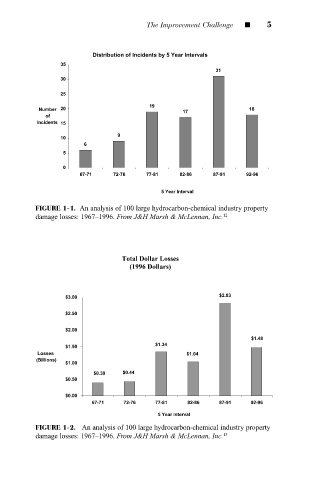
Distribution of Incidents by 5 Year Intervals
35
31
30
25
19
Number 20 18
17
of
Incidents 15
9
10
6
5
0
67-71 72-76 77-81 82-86 87-91 92-96
5 Year Interval
FIGURE 1-1. An analysis of 100 large hydrocarbon-chemical industry property
damage losses: 1967–1996. From J&H Marsh & McLennan, Inc. 12
Total Dollar Losses
(1996 Dollars)
$2.83
$3.00
$2.50
$2.00
$1.48
$1.34
$1.50
Losses $1.04
(Billions)
$1.00
$0.39 $0.44
$0.50
$0.00
67-71 72-76 77-81 82-86 87-91 92-96
5 Year Interval
FIGURE 1-2. An analysis of 100 large hydrocarbon-chemical industry property
damage losses: 1967–1996. From J&H Marsh & McLennan, Inc. 13