
Page 22 - Serious Incident Prevention How to Achieve and Sustain Accident-Free Operations in Your Plant or Company
P. 22
CH01pp001-020 4/10/02 12:49 PM Page 8
8 Serious Incident Prevention
LESS
CONTROLLABLE
6%
NOT KNOWN
14%
CONTROLLABLE
80%
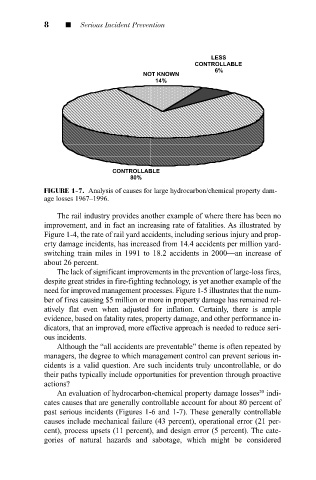
FIGURE 1-7. Analysis of causes for large hydrocarbon/chemical property dam-
age losses 1967–1996.
The rail industry provides another example of where there has been no
improvement, and in fact an increasing rate of fatalities. As illustrated by
Figure 1-4, the rate of rail yard accidents, including serious injury and prop-
erty damage incidents, has increased from 14.4 accidents per million yard-
switching train miles in 1991 to 18.2 accidents in 2000—an increase of
about 26 percent.
The lack of significant improvements in the prevention of large-loss fires,
despite great strides in fire-fighting technology, is yet another example of the
need for improved management processes. Figure 1-5 illustrates that the num-
ber of fires causing $5 million or more in property damage has remained rel-
atively flat even when adjusted for inflation. Certainly, there is ample
evidence, based on fatality rates, property damage, and other performance in-
dicators, that an improved, more effective approach is needed to reduce seri-
ous incidents.
Although the “all accidents are preventable” theme is often repeated by
managers, the degree to which management control can prevent serious in-
cidents is a valid question. Are such incidents truly uncontrollable, or do
their paths typically include opportunities for prevention through proactive
actions?
20
An evaluation of hydrocarbon-chemical property damage losses indi-
cates causes that are generally controllable account for about 80 percent of
past serious incidents (Figures 1-6 and 1-7). These generally controllable
causes include mechanical failure (43 percent), operational error (21 per-
cent), process upsets (11 percent), and design error (5 percent). The cate-
gories of natural hazards and sabotage, which might be considered