
Page 20 - Serious Incident Prevention How to Achieve and Sustain Accident-Free Operations in Your Plant or Company
P. 20
CH01pp001-020 4/10/02 12:49 PM Page 6
6 Serious Incident Prevention
Fatal Injuries
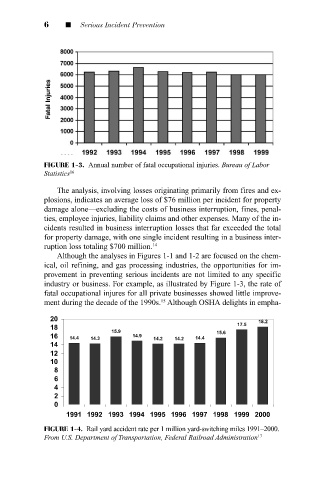
FIGURE 1-3. Annual number of fatal occupational injuries. Bureau of Labor
Statistics 16
The analysis, involving losses originating primarily from fires and ex-
plosions, indicates an average loss of $76 million per incident for property
damage alone—excluding the costs of business interruption, fines, penal-
ties, employee injuries, liability claims and other expenses. Many of the in-
cidents resulted in business interruption losses that far exceeded the total
for property damage, with one single incident resulting in a business inter-
ruption loss totaling $700 million. 14
Although the analyses in Figures 1-1 and 1-2 are focused on the chem-
ical, oil refining, and gas processing industries, the opportunities for im-
provement in preventing serious incidents are not limited to any specific
industry or business. For example, as illustrated by Figure 1-3, the rate of
fatal occupational injures for all private businesses showed little improve-
15
ment during the decade of the 1990s. Although OSHA delights in empha-
20 18.2
17.5
18
15.9 15.6
16 14.4 14.3 14.9 14.2 14.2 14.4
14
12
10
8
6
4
2
0
1991 1992 1993 1994 1995 1996 1997 1998 1999 2000
FIGURE 1-4. Rail yard accident rate per 1 million yard-switching miles 1991–2000.
From U.S. Department of Transportation, Federal Railroad Administration 17