
Page 21 - Serious Incident Prevention How to Achieve and Sustain Accident-Free Operations in Your Plant or Company
P. 21
CH01pp001-020 4/10/02 12:49 PM Page 7
The Improvement Challenge 7
60
54
50 46
42 42
40 40 40
40
34
30 28
20
10
0
1991 1992 1993 1994 1995 1996 1997 1998 1999
FIGURE 1-5. Large-loss fires that caused $5 million or more in property dam-
age, 1991–1999 adjusted to 1990 dollars. 18
sizing that workplace fatalities are now about 60 percent lower than the
14,000 annual fatalities occurring when the agency was enacted in 1971, the
trend of the 1990s clearly indicates that the performance of businesses in
preventing fatalities is stuck on a plateau.
Mechanical Failure 43%
Operational Error 21%
Not Known 14%
Process Upset 11%
Natural Hazard 5%
Design Error 5%
Sabotage/Arson 1%
0% 5% 10% 15% 20% 25% 30% 35% 40% 45%
PERCENT OF LOSSES
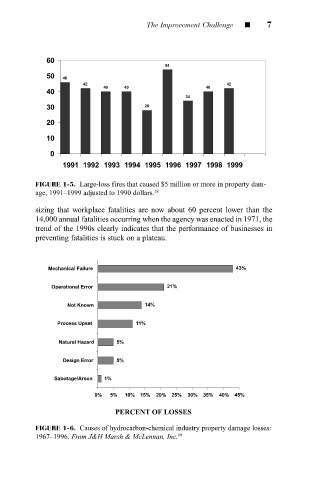
FIGURE 1-6. Causes of hydrocarbon-chemical industry property damage losses:
1967–1996. From J&H Marsh & McLennan, Inc. 19