
Page 150 - Shale Shakers Drilling Fluid Systems
P. 150
SHALE SHAKER SCREENS 133
TABLE 6-9. Comparison of Image Analysis of Separation Potential with Measured Cut Points
Measured D 50 Calculated I. A. d 50
API Screen Aspect Cut Point Separation Potential Percent Variation
Designation Ratio (microns) (microns) (%)
60 x 40 (200 x 406, 31. 1) 2.03/1 249 253 1.6
40 x 20 (310 x 90, 36.8) 2.94/1 447 444 0.7
80 x 40 (140 x 460, 35.6) 3.29/1 204 208 2.0
70 x 30 (178 x 660, 40.3) 3.71/1 236 276 16.9
60 x 24 (200 x 830, 41.5) 4.15/1 264 321 21.6
35 x 12 (320 x 1700, 42.0) 5.31/1 493 558 13.2
microns to 280 microns. Again, if the sepa-
ration potential curve shown is analogous to
the percent separated curve, all solids larger
than 280 microns will be rejected and solids
smaller than 180 microns will be retained.
This is a separation range of 100 microns
(280 - 180). The separation potential d 50 is
205 microns.
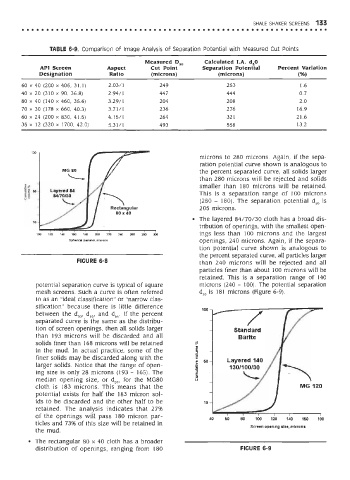
• The layered 84/70/30 cloth has a broad dis-
tribution of openings, with the smallest open-
ings less than 100 microns and the largest
openings, 240 microns. Again, if the separa-
tion potential curve shown is analogous to
the percent separated curve, all particles larger
FIGURE 6-8 than 240 microns will be rejected and all
particles finer than about 100 microns will be
retained. This is a separation range of 140
potential separation curve is typical of square microns (240 - 100). The potential separation
mesh screens. Such a curve is often referred d is 181 microns (Figure 6-9).
to as an "ideal classification" or "narrow clas-
sification" because there is little difference
between the d 50, d 16, and d 84. If the percent
separated curve is the same as the distribu-
tion of screen openings, then all solids larger
than 193 microns will be discarded and all
solids finer than 168 microns will be retained
in the mud. In actual practice, some of the
finer solids may be discarded along with the
larger solids. Notice that the range of open-
ing size is only 28 microns (193 - 165). The
median opening size, or d 50, for the MG80
cloth is 183 microns. This means that the
potential exists for half the 183 micron sol-
ids to be discarded and the other half to be
retained. The analysis indicates that 27%
of the openings will pass 180 micron par-
ticles and 73% of this size will be retained in
the mud.
The rectangular 80 x 40 cloth has a broader
distribution of openings, ranging from 180 FIGURE 6-9