
Page 146 - Shale Shakers Drilling Fluid Systems
P. 146
SHALE SHAKER SCREENS 129
has been adopted by the API as a Recommended
Practice for Designations of Shale Shaker Screens,
API RP 13E, 3rd edition, May 1, 1995. This recom-
mended practice supersedes the second edition
(1985) which was valid only for single-layer screens.
The new designation system conveys informa-
tion on the screen-opening size distribution and
the ability of a nonvibrating screen to pass fluid.
The following information is stamped on a tag
attached to the screen panel, which is visible
and legible after the screen is installed on the
shale shaker:
Manufacturer's Designation
Separation Potential
d d d
50' !6< 84
Flow Capacity
Conductance
Total Non-Blanked Area
Manufacturer's Designation
The screen manufacturer may name a particu-
lar screen in any manner desirable. The manu- FIGURE 6-5
facturer's designation is used when ordering a
shaker screen with particular characteristics.
Separation Potential
The separation potential analysis determines
an ellipsoid volume that fits in each of the screen
openings. The length and width of 1,500 openings
in multiple-layered screens and 750 openings in
single-layered screens are measured, and an ellip-
soid volume is calculated for each opening with
the following equation (Figure 6-5A):
2
Ve = (3.14 x la x lb )/6
3
where Ve = Volume of the ellipsoid (microns )
la = Length of major axis (microns)
Ib = Length of minor axis (microns) FIGURE 6-6
The diameter of a sphere having the same vol-
ume (Figure 6-5B) is then calculated for each of
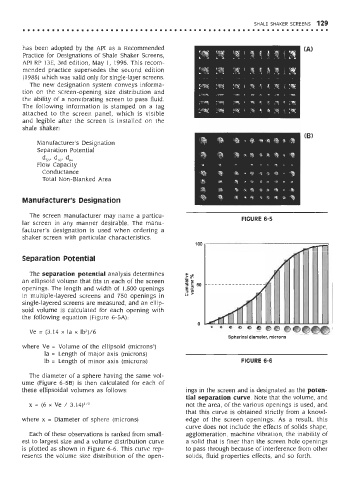
these ellipsoidal volumes as follows: ings in the screen and is designated as the poten-
tial separation curve. Note that the volume, and
x = (6 x Ve / 3.14) 173 not the area, of the various openings is used, and
that this curve is obtained strictly from a knowl-
where x = Diameter of sphere (microns) edge of the screen openings. As a result, this
curve does not include the effects of solids shape,
Each of these observations is ranked from small- agglomeration, machine vibration, the inability of
est to largest size and a volume distribution curve a solid that is finer than the screen hole openings
is plotted as shown in Figure 6-6. This curve rep- to pass through because of interference from other
resents the volume size distribution of the open- solids, fluid properties effects, and so forth.