
Page 142 - Shale Shakers Drilling Fluid Systems
P. 142
SHALE SHAKER SCREENS 125
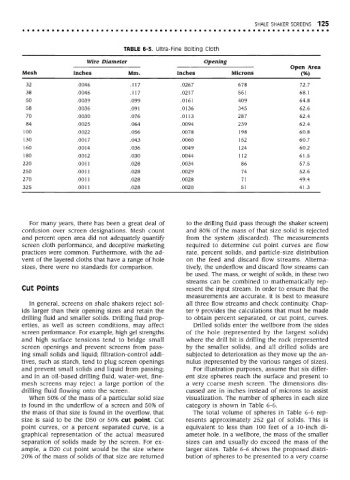
TABLE 6-3. Ultra-Fine Bolting Cloth
Wire Diameter Opening
Open Area
Mesh Inches Mm. Inches Microns (%)
32 .0046 .117 .0267 678 72.7
38 .0046 .117 .0217 551 68.1
50 .0039 .099 .0161 409 64.8
58 .0036 .091 .0136 345 62.6
70 .0030 .076 .0113 287 62.4
84 .0025 .064 .0094 239 62.4
100 .0022 .056 .0078 198 60.8
130 .0017 .043 .0060 152 60.7
160 .0014 .036 .0049 124 60.2
180 .0012 .030 .0044 112 61.5
220 .0011 .028 .0034 86 57.5
250 .0011 .028 .0029 74 52.6
270 .0011 .028 .0028 71 49.4
325 .0011 .028 .0020 51 41.3
For many years, there has been a great deal of to the drilling fluid (pass through the shaker screen)
confusion over screen designations. Mesh count and 80% of the mass of that size solid is rejected
and percent open area did not adequately quantify from the system (discarded). The measurements
screen cloth performance, and deceptive marketing required to determine cut point curves are flow
practices were common. Furthermore, with the ad- rate, percent solids, and particle-size distribution
vent of the layered cloths that have a range of hole on the feed and discard flow streams. Alterna-
sizes, there were no standards for comparison. tively, the underflow and discard flow streams can
be used. The mass, or weight of solids, in these two
streams can be combined to mathematically rep-
Cut Points resent the input stream. In order to ensure that the
measurements are accurate, it is best to measure
In general, screens on shale shakers reject sol- all three flow streams and check continuity. Chap-
ids larger than their opening sizes and retain the ter 9 provides the calculations that must be made
drilling fluid and smaller solids. Drilling fluid prop- to obtain percent separated, or cut point, curves.
erties, as well as screen conditions, may affect Drilled solids enter the wellbore from the sides
screen performance. For example, high gel strengths of the hole (represented by the largest solids)
and high surface tensions tend to bridge small where the drill bit is drilling the rock (represented
screen openings and prevent screens from pass- by the smaller solids), and all drilled solids are
ing small solids and liquid; filtration-control addi- subjected to deterioration as they move up the an-
tives, such as starch, tend to plug screen openings nulus (represented by the various ranges of sizes).
and prevent small solids and liquid from passing; For illustration purposes, assume that six differ-
and in an oil-based drilling fluid, water-wet, fine- ent size spheres reach the surface and present to
mesh screens may reject a large portion of the a very coarse mesh screen. The dimensions dis-
drilling fluid flowing onto the screen. cussed are in inches instead of microns to assist
When 50% of the mass of a particular solid size visualization. The number of spheres in each size
is found in the underflow of a screen and 50% of category is shown in Table 6-6.
the mass of that size is found in the overflow, that The total volume of spheres in Table 6-6 rep-
size is said to be the D50 or 50% cut point. Cut resents approximately 252 gal of solids. This is
point curves, or a percent separated curve, is a equivalent to less than 100 feet of a 10-inch di-
graphical representation of the actual measured ameter hole. In a wellbore, the mass of the smaller
separation of solids made by the screen. For ex- sizes can and usually do exceed the mass of the
ample, a D20 cut point would be the size where larger sizes. Table 6-6 shows the proposed distri-
20% of the mass of solids of that size are returned bution of spheres to be presented to a very coarse