
Page 144 - Shale Shakers Drilling Fluid Systems
P. 144
SHALE SHAKER SCREENS 127
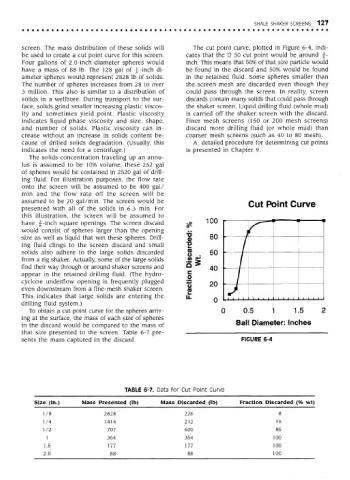
screen. The mass distribution of these solids will The cut point curve, plotted in Figure 6-4, indi-
be used to create a cut point curve for this screen. cates that the D 50 cut point would be around -f-
Four gallons of 2.0-inch diameter spheres would inch. This means that 50% of that size particle would
have a mass of 88 Ib. The 128 gal of i-inch di- be found in the discard and 50% would be found
O O
ameter spheres would represent 2828 Ib of solids. in the retained fluid. Some spheres smaller than
The number of spheres increases from 28 to over the screen mesh are discarded even though they
3 million. This also is similar to a distribution of could pass through the screen. In reality, screen
solids in a wellbore. During transport to the sur- discards contain many solids that could pass through
face, solids grind smaller increasing plastic viscos- the shaker screen. Liquid drilling fluid (whole mud)
ity and sometimes yield point. Plastic viscosity is carried off the shaker screen with the discard.
indicates liquid phase viscosity and size, shape, Finer mesh screens (150 or 200 mesh screens)
and number of solids. Plastic viscosity can in- discard more drilling fluid (or whole mud) than
crease without an increase in solids content be- coarser mesh screens (such as 40 to 80 mesh).
cause of drilled solids degradation. (Usually, this A detailed procedure for determining cut points
indicates the need for a centrifuge.) is presented in Chapter 9.
The solids concentration traveling up an annu-
lus is assumed to be 10% volume, these 252 gal
of spheres would be contained in 2520 gal of drill-
ing fluid. For illustration purposes, the flow rate
onto the screen will be assumed to be 400 gal/
min and the flow rate off the screen will be
assumed to be 20 gal/min. The screen would be
presented with all of the solids in 6.3 min. For
this illustration, the screen will be assumed to
have |-inch square openings. The screen discard
would consist of spheres larger than the opening
size as well as liquid that wet these spheres. Drill-
ing fluid clings to the screen discard and small
solids also adhere to the large solids discarded
from a rig shaker. Actually, some of the large solids
find their way through or around shaker screens and
appear in the retained drilling fluid. (The hydro-
cyclone underflow opening is frequently plugged
even downstream from a fine-mesh shaker screen.
This indicates that large solids are entering the
drilling fluid system.)
To obtain a cut point curve for the spheres arriv-
ing at the surface, the mass of each size of spheres
in the discard would be compared to the mass of
that size presented to the screen. Table 6-7 pre-
sents the mass captured in the discard. FIGURE 6-4
TABLE 6-7. Data for Cut Point Curve
c
Size (in.) Mass Presented (Ib) Mass Discarded (Ib) Fraction Discarded ( Yo wt)
1/8 2828 226 8
1/4 1414 212 15
1/2 707 600 85
1 354 354 100
1.5 177 177 100
2.0 88 88 100