
Page 242 - Shigley's Mechanical Engineering Design
P. 242
bud29281_ch05_212-264.qxd 12/7/09 7:22PM Page 217 ntt G4 Mac OS 9.2:Desktop Folder:MHDQ196/Budynas:
Failures Resulting from Static Loading 217
More often than not it is necessary to design using only published values of yield
strength, ultimate strength, percentage reduction in area, and percentage elongation,
such as those listed in Appendix A. How can one use such meager data to design against
both static and dynamic loads, two- and three-dimensional stress states, high and low
temperatures, and very large and very small parts? These and similar questions will be
addressed in this chapter and those to follow, but think how much better it would be to
have data available that duplicate the actual design situation.
5–2 Stress Concentration
Stress concentration (see Sec. 3–13) is a highly localized effect. In some instances it
may be due to a surface scratch. If the material is ductile and the load static, the design
load may cause yielding in the critical location in the notch. This yielding can involve
strain strengthening of the material and an increase in yield strength at the small criti-
cal notch location. Since the loads are static and the material is ductile, that part can
carry the loads satisfactorily with no general yielding. In these cases the designer sets
the geometric (theoretical) stress-concentration factor K t to unity.
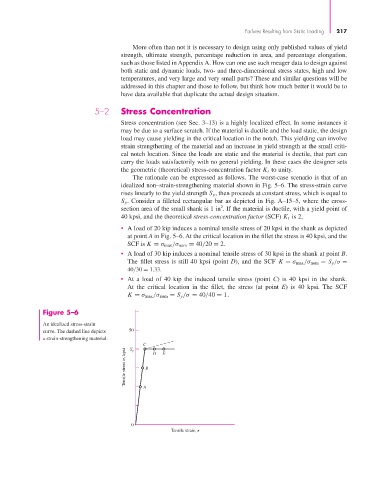
The rationale can be expressed as follows. The worst-case scenario is that of an
idealized non–strain-strengthening material shown in Fig. 5–6. The stress-strain curve
rises linearly to the yield strength S y , then proceeds at constant stress, which is equal to
S y . Consider a filleted rectangular bar as depicted in Fig. A–15–5, where the cross-
2
section area of the small shank is 1 in . If the material is ductile, with a yield point of
40 kpsi, and the theoretical stress-concentration factor (SCF) K t is 2,
• A load of 20 kip induces a nominal tensile stress of 20 kpsi in the shank as depicted
at point A in Fig. 5–6. At the critical location in the fillet the stress is 40 kpsi, and the
SCF is K = σ max /σ nom = 40/20 = 2.
• A load of 30 kip induces a nominal tensile stress of 30 kpsi in the shank at point B.
The fillet stress is still 40 kpsi (point D), and the SCF K = σ max /σ nom = S y /σ =
40/30 = 1.33.
• At a load of 40 kip the induced tensile stress (point C) is 40 kpsi in the shank.
At the critical location in the fillet, the stress (at point E) is 40 kpsi. The SCF
K = σ max /σ nom = S y /σ = 40/40 = 1.
Figure 5–6
An idealized stress-strain
curve. The dashed line depicts 50
a strain-strengthening material.
C D E
Tensile stress , kpsi B
S y
A
0
Tensile strain,