Page 351 - Shigley's Mechanical Engineering Design
P. 351

bud29281_ch06_265-357.qxd  12/02/2009  7:26 pm  Page 326 pinnacle s-171:Desktop Folder:Temp Work:Don't Delete (Jobs):MHDQ196/Budynas:


                 326   Mechanical Engineering Design
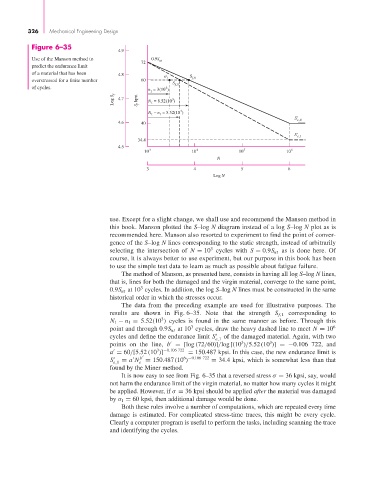
                  Figure 6–35
                                             4.9
                  Use of the Manson method to          0.9S ut
                                                    72
                  predict the endurance limit
                  of a material that has been  4.8
                  overstressed for a finite number   60      1      S f,0
                                                             S f,1
                  of cycles.                               3
                                                      n  = 3(10 )
                                                       1
                                           Log S f  4.7  S f  kpsi  N  = 8.52(10 )
                                                             3
                                                       1
                                                      N  – n  = 5.52(10 ) 3
                                                       1  1
                                                                                                   S' e,0
                                             4.6    40
                                                                                                   S' e,1
                                                   34.4
                                             4.5
                                                     10  3         10  4          10 5          10 6
                                                                           N
                                                     3              4             5              6
                                                                           Log N


                                          use. Except for a slight change, we shall use and recommend the Manson method in
                                          this book. Manson plotted the S–log N diagram instead of a log S–log N plot as is
                                          recommended here. Manson also resorted to experiment to find the point of conver-
                                          gence of the S–log N lines corresponding to the static strength, instead of arbitrarily
                                                                         3
                                          selecting the intersection of  N = 10 cycles with  S = 0.9S ut as is done here. Of
                                          course, it is always better to use experiment, but our purpose in this book has been
                                          to use the simple test data to learn as much as possible about fatigue failure.
                                              The method of Manson, as presented here, consists in having all log S–log N lines,
                                          that is, lines for both the damaged and the virgin material, converge to the same point,
                                                   3
                                          0.9S ut at 10 cycles. In addition, the log S–log N lines must be constructed in the same
                                          historical order in which the stresses occur.
                                              The data from the preceding example are used for illustrative purposes.  The
                                          results are shown in Fig. 6–35. Note that the strength  S f,1 corresponding to
                                                          3
                                          N 1 − n 1 = 5.52(10 ) cycles is found in the same manner as before. Through this
                                                                   3
                                          point and through 0.9S ut at 10 cycles, draw the heavy dashed line to meet N = 10 6
                                          cycles and define the endurance limit S    of the damaged material. Again, with two
                                                                           e,1
                                                                                           3
                                                                                   3

                                          points on the line,  b = [log (72/60)]/log [(10 )/5.52 (10 )] =−0.106 722, and
                                                         3 −0.106 722

                                          a = 60/[5.52 (10 )]     = 150.487 kpsi. In this case, the new endurance limit is

                                                                 6 −0.106 722
                                                   b

                                          S    = a N = 150.487 (10 )     = 34.4 kpsi, which is somewhat less than that
                                           e,1     e
                                          found by the Miner method.
                                              It is now easy to see from Fig. 6–35 that a reversed stress σ = 36 kpsi, say, would
                                          not harm the endurance limit of the virgin material, no matter how many cycles it might
                                          be applied. However, if σ = 36 kpsi should be applied after the material was damaged
                                          by σ 1 = 60 kpsi, then additional damage would be done.
                                              Both these rules involve a number of computations, which are repeated every time
                                          damage is estimated. For complicated stress-time traces, this might be every cycle.
                                          Clearly a computer program is useful to perform the tasks, including scanning the trace
                                          and identifying the cycles.
   346   347   348   349   350   351   352   353   354   355   356