
Page 346 - Shigley's Mechanical Engineering Design
P. 346
bud29281_ch06_265-357.qxd 11/30/2009 4:23 pm Page 321 pinnacle s-171:Desktop Folder:Temp Work:Don't Delete (Jobs):MHDQ196/Budynas:
Fatigue Failure Resulting from Variable Loading 321
From the same table, with r = σ /σ = 26.5/99.8 = 0.28, the strengths can be shown
a m
to be S a = 85.5 MPa and S m = 305 MPa. See the plot in Fig. 6–32.
The first-cycle yield factor of safety n y is
Answer n y = S y = 370 = 2.93
σ + σ m 26.5 + 99.8
a
There is no notch yielding. The likelihood of failure may first come from first-cycle
yielding at the notch. See the plot in Fig. 6–32.
6–15 Varying, Fluctuating Stresses;
Cumulative Fatigue Damage
Instead of a single fully reversed stress history block composed of n cycles, suppose a
machine part, at a critical location, is subjected to
• A fully reversed stress σ 1 for n 1 cycles, σ 2 for n 2 cycles, ..., or
• A “wiggly” time line of stress exhibiting many and different peaks and valleys.
What stresses are significant, what counts as a cycle, and what is the measure of
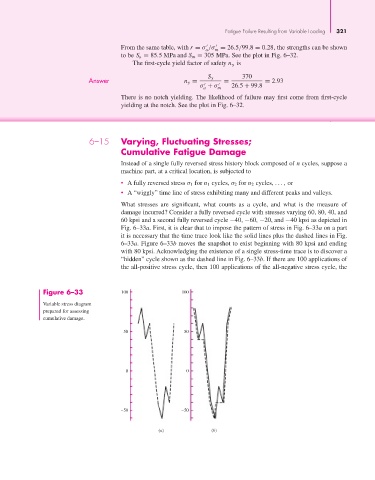
damage incurred? Consider a fully reversed cycle with stresses varying 60, 80, 40, and
60 kpsi and a second fully reversed cycle −40, −60, −20, and −40 kpsi as depicted in
Fig. 6–33a. First, it is clear that to impose the pattern of stress in Fig. 6–33a on a part
it is necessary that the time trace look like the solid lines plus the dashed lines in Fig.
6–33a. Figure 6–33b moves the snapshot to exist beginning with 80 kpsi and ending
with 80 kpsi. Acknowledging the existence of a single stress-time trace is to discover a
“hidden” cycle shown as the dashed line in Fig. 6–33b. If there are 100 applications of
the all-positive stress cycle, then 100 applications of the all-negative stress cycle, the
Figure 6–33 100 100
Variable stress diagram
prepared for assessing
cumulative damage.
50 50
0 0
–50 –50
(a) (b)