
Page 357 - Shigley's Mechanical Engineering Design
P. 357
bud29281_ch06_265-357.qxd 12/02/2009 6:49 pm Page 332 pinnacle s-171:Desktop Folder:Temp Work:Don't Delete (Jobs):MHDQ196/Budynas:
332 Mechanical Engineering Design
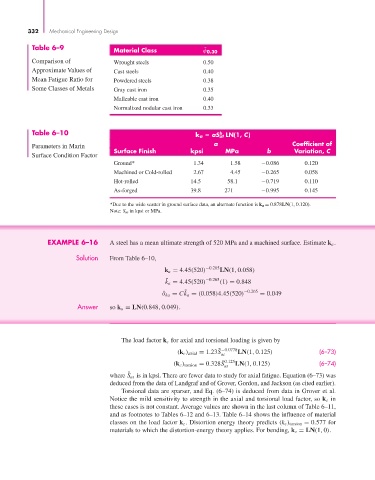
Table 6–9
Material Class φ 0.30
Comparison of Wrought steels 0.50
Approximate Values of Cast steels 0.40
Mean Fatigue Ratio for Powdered steels 0.38
Some Classes of Metals Gray cast iron 0.35
Malleable cast iron 0.40
Normalized nodular cast iron 0.33
Table 6–10 k a aS ut LN(1, C)
b
Parameters in Marin a Coefficient of
Surface Finish kpsi MPa b Variation, C
Surface Condition Factor
Ground* 1.34 1.58 −0.086 0.120
Machined or Cold-rolled 2.67 4.45 −0.265 0.058
Hot-rolled 14.5 58.1 −0.719 0.110
As-forged 39.8 271 −0.995 0.145
*Due to the wide scatter in ground surface data, an alternate function is k a = 0.878LN(1, 0.120).
Note: S ut in kpsi or MPa.
EXAMPLE 6–16 A steel has a mean ultimate strength of 520 MPa and a machined surface. Estimate k a .
Solution From Table 6–10,
k a = 4.45(520) −0.265 LN(1, 0.058)
¯
k a = 4.45(520) −0.265 (1) = 0.848
ˆ σ ka = Ck a = (0.058)4.45(520) −0.265 = 0.049
¯
Answer so k a = LN(0.848, 0.049).
The load factor k c for axial and torsional loading is given by
−0.0778
(k c ) axial = 1.23S ¯ ut LN(1, 0.125) (6–73)
0.125
(k c ) torsion = 0.328S ¯ ut LN(1, 0.125) (6–74)
where S ut is in kpsi. There are fewer data to study for axial fatigue. Equation (6–73) was
¯
deduced from the data of Landgraf and of Grover, Gordon, and Jackson (as cited earlier).
Torsional data are sparser, and Eq. (6–74) is deduced from data in Grover et al.
Notice the mild sensitivity to strength in the axial and torsional load factor, so k c in
these cases is not constant. Average values are shown in the last column of Table 6–11,
and as footnotes to Tables 6–12 and 6–13. Table 6–14 shows the influence of material
classes on the load factor k c . Distortion energy theory predicts (k c ) torsion = 0.577 for
materials to which the distortion-energy theory applies. For bending, k c = LN(1, 0).