Page 358 - Shigley's Mechanical Engineering Design
P. 358

bud29281_ch06_265-357.qxd  12/10/2009  4:46 pm  Page 333 pinnacle s-171:Desktop Folder:Temp Work:Don't Delete (Jobs):MHDQ196/Budynas:


                                                                               Fatigue Failure Resulting from Variable Loading  333
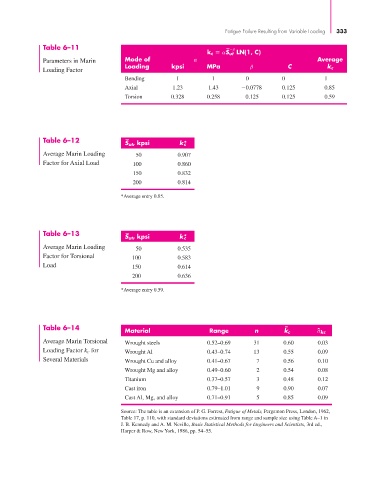
                       Table 6–11                                               −β
                                                                         k c   αS ut LN(1, C)
                       Parameters in Marin      Mode of              α                                     Average
                                                Loading       kpsi       MPa           β          C           k c
                       Loading Factor
                                                Bending         1          1         0          0            1
                                                Axial          1.23       1.43      −0.0778     0.125        0.85
                                                Torsion       0.328      0.258       0.125      0.125        0.59


                       Table 6–12               S ut, kpsi       k* c

                       Average Marin Loading       50           0.907
                       Factor for Axial Load      100           0.860
                                                  150           0.832
                                                  200           0.814

                                               *Average entry 0.85.


                       Table 6–13               S ut, kpsi       k* c

                       Average Marin Loading       50           0.535
                       Factor for Torsional       100           0.583
                       Load                       150           0.614
                                                  200           0.636

                                               *Average entry 0.59.


                       Table 6–14                                                                ¯
                                                Material                  Range         n        k c       σ
                                                                                                           ˆ kc
                       Average Marin Torsional  Wrought steels           0.52–0.69      31       0.60      0.03
                       Loading Factor k c for   Wrought Al               0.43–0.74      13       0.55      0.09
                       Several Materials        Wrought Cu and alloy     0.41–0.67       7       0.56      0.10
                                                Wrought Mg and alloy     0.49–0.60       2       0.54      0.08
                                                Titanium                 0.37–0.57       3       0.48      0.12
                                                Cast iron                0.79–1.01       9       0.90      0.07
                                                Cast Al, Mg, and alloy   0.71–0.91       5       0.85      0.09
                                               Source: The table is an extension of P. G. Forrest, Fatigue of Metals, Pergamon Press, London, 1962,
                                               Table 17, p. 110, with standard deviations estimated from range and sample size using Table A–1 in
                                               J. B. Kennedy and A. M. Neville, Basic Statistical Methods for Engineers and Scientists, 3rd ed.,
                                               Harper & Row, New York, 1986, pp. 54–55.
   353   354   355   356   357   358   359   360   361   362   363