Page 367 - Shigley's Mechanical Engineering Design
P. 367

bud29281_ch06_265-357.qxd  11/30/2009  4:24 pm  Page 342 pinnacle s-171:Desktop Folder:Temp Work:Don't Delete (Jobs):MHDQ196/Budynas:


                 342   Mechanical Engineering Design
                  Figure 6–38

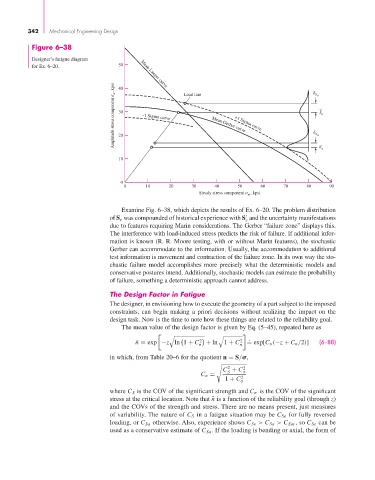
                  Designer’s fatigue diagram
                  for Ex. 6–20.              50     Mean Langer curve


                                           Amplitude stress component   a , kpsi  30  –1 Sigma curve  Load line  Mean Gerber curve    S a  _ S a
                                             40


                                                                                +1 Sigma curve
                                                                                                             a
                                             20
                                                                                                           _
                                             10                                                             a


                                             0
                                              0      10     20     30     40     50     60      70     80     90
                                                                      Steady stress component   m , kpsi

                                              Examine Fig. 6–38, which depicts the results of Ex. 6–20. The problem distribution

                                          of S e was compounded of historical experience with S and the uncertainty manifestations
                                                                                    e
                                          due to features requiring Marin considerations. The Gerber “failure zone” displays this.
                                          The interference with load-induced stress predicts the risk of failure. If additional infor-
                                          mation is known (R. R. Moore testing, with or without Marin features), the stochastic
                                          Gerber can accommodate to the information. Usually, the accommodation to additional
                                          test information is movement and contraction of the failure zone. In its own way the sto-
                                          chastic failure model accomplishes more precisely what the deterministic models and
                                          conservative postures intend. Additionally, stochastic models can estimate the probability
                                          of failure, something a deterministic approach cannot address.

                                          The Design Factor in Fatigue
                                          The designer, in envisioning how to execute the geometry of a part subject to the imposed
                                          constraints, can begin making a priori decisions without realizing the impact on the
                                          design task. Now is the time to note how these things are related to the reliability goal.
                                              The mean value of the design factor is given by Eq. (5–45), repeated here as

                                                                                     .
                                                            '               '
                                                                      2           2
                                                  ¯ n = exp −z ln 1 + C  + ln 1 + C  = exp[C n (−z + C n /2)]  (6–88)
                                                                     n            n
                                          in which, from Table 20–6 for the quotient n = S/ ,
                                                                              2
                                                                             C + C 2 σ
                                                                              S
                                                                      C n =
                                                                             1 + C 2
                                                                                  σ
                                          where C S is the COV of the significant strength and C σ is the COV of the significant
                                          stress at the critical location. Note that ¯n is a function of the reliability goal (through z)
                                          and the COVs of the strength and stress. There are no means present, just measures
                                          of variability. The nature of C S in a fatigue situation may be C Se for fully reversed
                                          loading, or C Sa otherwise. Also, experience shows C Se > C Sa > C Sut , so C Se can be
                                          used as a conservative estimate of C Sa . If the loading is bending or axial, the form of
   362   363   364   365   366   367   368   369   370   371   372