
Page 305 -
P. 305
304 L.R Izquierdo et al.
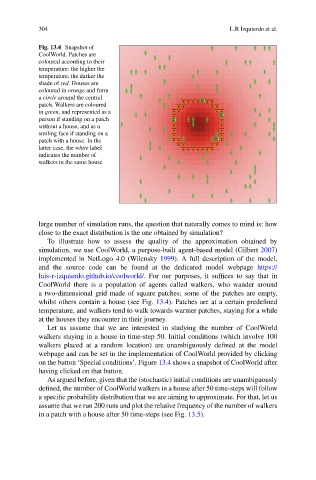
Fig. 13.4 Snapshot of
CoolWorld. Patches are
coloured according to their
temperature: the higher the
temperature, the darker the
shade of red. Houses are
coloured in orange and form
a circle around the central
patch. Walkers are coloured
in green, and represented as a
person if standing on a patch
without a house, and as a
smiling face if standing on a
patch with a house. In the
latter case, the white label
indicates the number of
walkers in the same house
large number of simulation runs, the question that naturally comes to mind is: how
close to the exact distribution is the one obtained by simulation?
To illustrate how to assess the quality of the approximation obtained by
simulation, we use CoolWorld, a purpose-built agent-based model (Gilbert 2007)
implemented in NetLogo 4.0 (Wilensky 1999). A full description of the model,
and the source code can be found at the dedicated model webpage https://
luis-r-izquierdo.github.io/coolworld/. For our purposes, it suffices to say that in
CoolWorld there is a population of agents called walkers, who wander around
a two-dimensional grid made of square patches; some of the patches are empty,
whilst others contain a house (see Fig. 13.4). Patches are at a certain predefined
temperature, and walkers tend to walk towards warmer patches, staying for a while
at the houses they encounter in their journey.
Let us assume that we are interested in studying the number of CoolWorld
walkers staying in a house in time-step 50. Initial conditions (which involve 100
walkers placed at a random location) are unambiguously defined at the model
webpage and can be set in the implementation of CoolWorld provided by clicking
on the button ‘Special conditions’. Figure 13.4 shows a snapshot of CoolWorld after
having clicked on that button.
As argued before, given that the (stochastic) initial conditions are unambiguously
defined, the number of CoolWorld walkers in a house after 50 time-steps will follow
a specific probability distribution that we are aiming to approximate. For that, let us
assume that we run 200 runs and plot the relative frequency of the number of walkers
in a patch with a house after 50 time-steps (see Fig. 13.5).